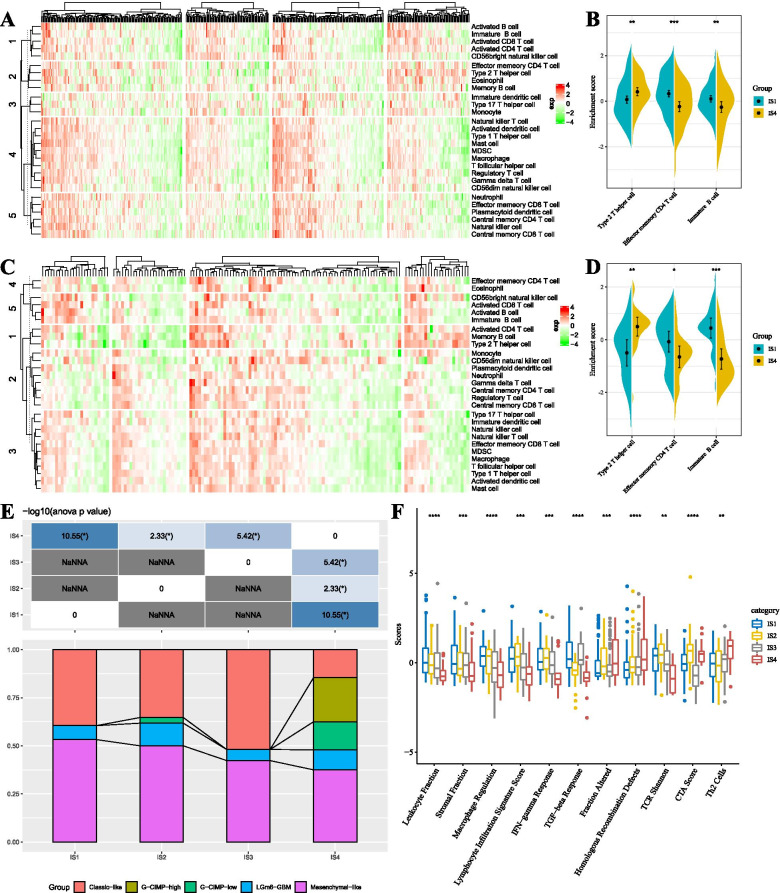
Fig. 5.
A The difference of enrichment scores of 28 immune cells in each subtype in the TCGA-GBM Agilent cohort. B The enrichment scores of immune cells with a significant difference in the good and poor prognosis subtypes in the TCGA-GBM Agilent cohort. C The difference of enrichment scores of 28 immune cells in each subtype in the TCGA-GBM HiSeq cohort. D The enrichment scores of immune cells with a significant difference in the good and poor prognosis subtypes in the TCGA-GBM HiSeq cohort. E The intersection of four immune molecular subtypes with the previous five molecular subtypes. F The distribution of four immune subtypes in 56 immune-related features; 11 immune features presented FDR < 0.05

