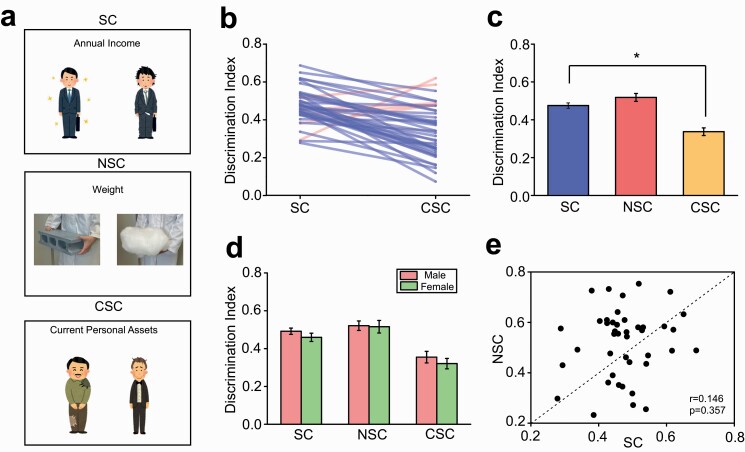
Figure 1.
Social bias test. (A) Diagrams illustrating examples of the SC, NSC, and CSC, where the faces and attires are contradicted for judgments. (B) A graph illustrating the individual changes on the discrimination index between the SC and CSC. The blue and red lines indicate those exhibiting decreases on the discrimination index in the CSC compared to SC and vice versa, respectively. (C) A graph illustrating the average changes on the discrimination index in the SC, NSC, and CSC. *P < .001. (D) A graph illustrating the changes on the discrimination index separately for male and female subjects. (E) A scatter plot showing the relationship on the discrimination index between the SC and NSC. Abbreviations: CSC, conflicted social condition; NSC, nonsocial judgement condition; SC, social condition.

