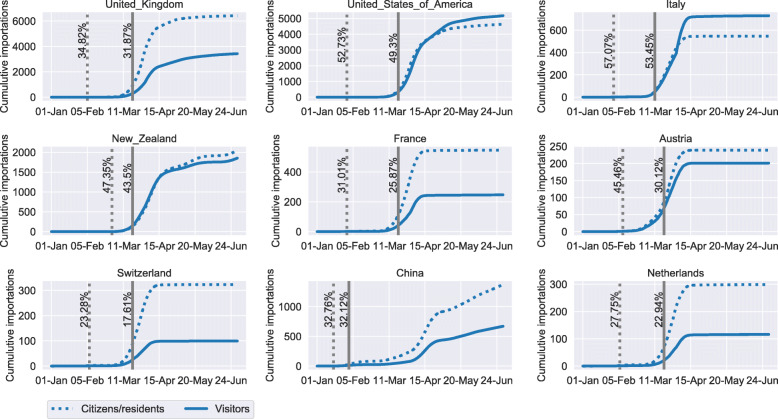
Fig. 3.
Estimated percentage reduction of imported COVID-19 cases. The estimated cumulative number of importations by Australian citizens/residents (dashed curve) and visitors (solid curve), assuming no travel bans are implemented. The vertical dashed line indicates the date when the cumulative number of visitor importations reached one. The corresponding label shows the expected percentage reduction in the total number of importations over the studied period if a travel ban had been implemented on the same day. The solid vertical line indicates the implementation date of the actual travel ban and the corresponding percentage reduction in imported cases

