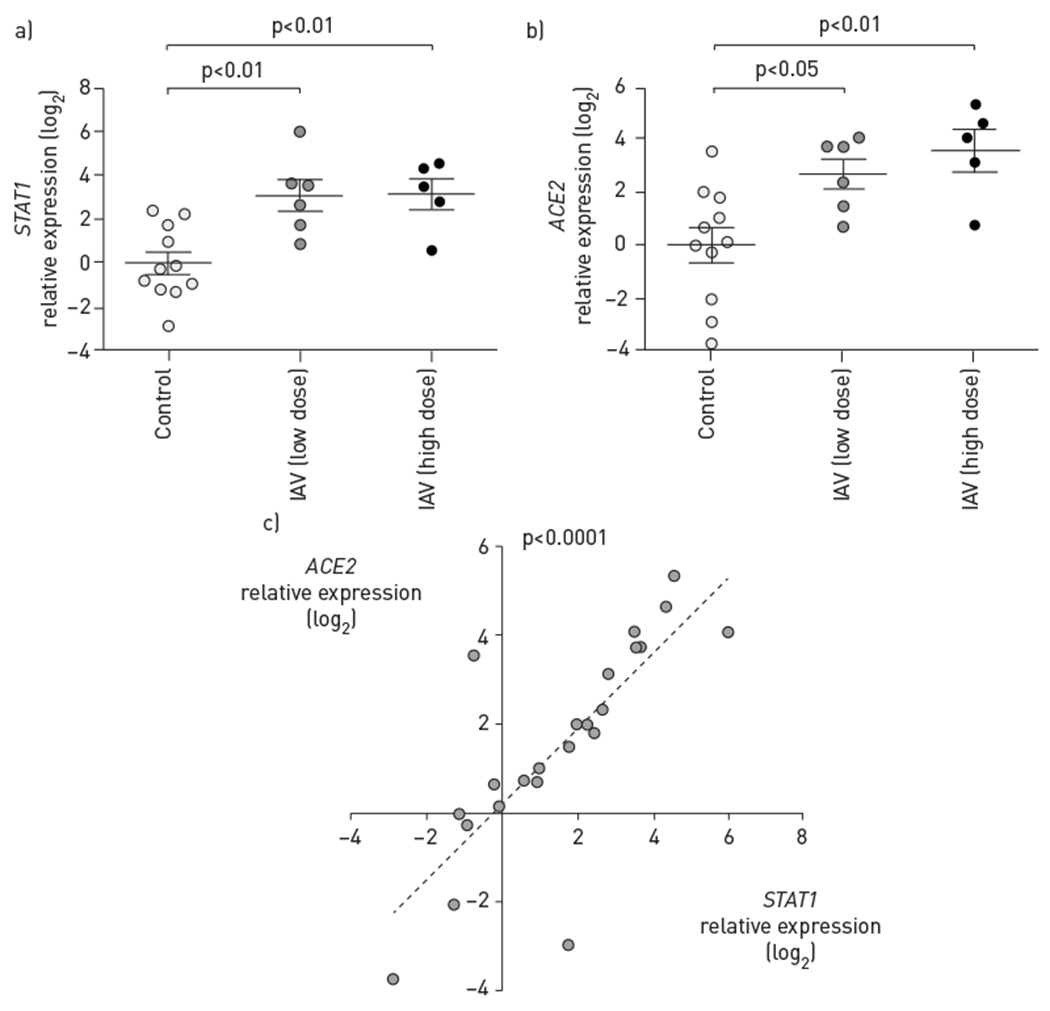
FIGURE 2.

Effect of influenza A virus (IAV) infection on ACE2 transcription in small airway epithelial cells (SAECs). Relative levels of a) STAT1 and b) ACE2 mRNA measured using reverse transcription quantitative PCR using 18S rRNA as control, expressed as log2 of 2−ΔΔCT, following infection of SAECs at the air—liquid interface with IAV low dose (H1N1 pdm09 virus, 3×10² pfu·transwell−1, 72 h) or high dose (H1N1 pdm09 virus, 3×10⁵ pfu·transwell−1, 48 h). Each data point represents an independent experiment from n=6 and n=4 (low and high dose, respectively). Data are presented as mean±SEM; one-way ANOVA—Sidak multiple comparison test. c) Correlation by linear regression between STAT1 and ACE2 expression levels in SAECs; each data point represents an independent IAV-infected or -uninfected experimental condition. Pearson correlation coefficient r=0.78; R2=0.61, p<0.0001.
