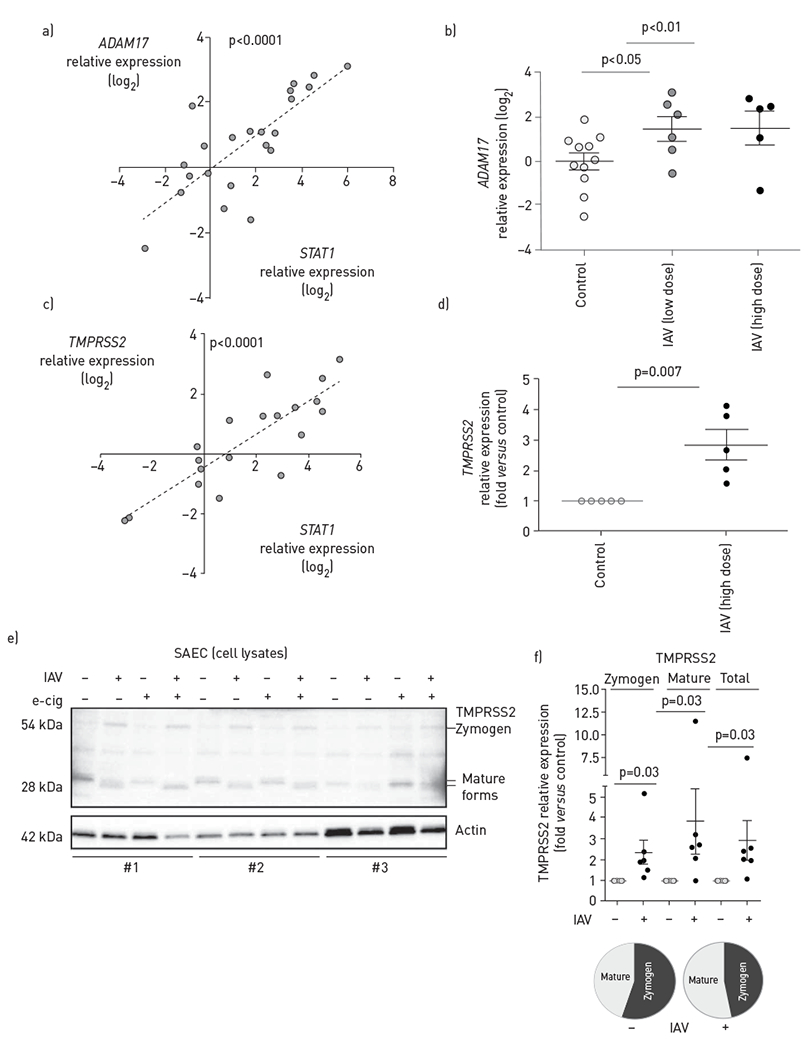
FIGURE 4.

Effect of influenza A virus (IAV) on ADAM17 and TMPRSS2 levels in small airway epithelial cells (SAECs). a–d) Expression levels of indicated proteases measured by reverse transcription (RT) quantitative PCR in SAECs uninfected or infected at the air—liquid interface with IAV at low dose (H1N1 pdm09 virus, 3×10² pfu·transwell−1, 72 h) or high dose (H1N1 pdm09, 3×10⁵ pfu·transwell−1, 48 h); each data point represents an independent experimental condition. a) Correlation between STAT1 and ADAM17 expression levels in SAECs by linear regression; Pearson correlation coefficient R2=0.59, p<0.0001; b) ADAM17 mRNA levels; c) correlation between STAT1 and TMPRSS2 expression levels in SAECs by linear regression; Pearson correlation coefficient R2=0.70, p<0.0001; d) TMPRSS2 mRNA levels. e) TMPRSS2 protein (zymogen and mature forms) in SAECs infected with IAV (+) compared to uninfected cells (−), with indicated pre-exposure (+) to e-cigarette vapour (e-cig) detected by Western blotting; cell lysates obtained from distinct donors (#1–3) are noted; f) relative changes in zymogen, mature and total TMPRSS2 levels induced by IAV were quantified by densitometry relative to uninfected controls, using actin loading control for normalisation. Individual data points indicate independent experiments; mean±SEM, Wilcoxon signed rank test. Pie charts indicating relative levels of mature forms of total TMPRSS2 protein.
