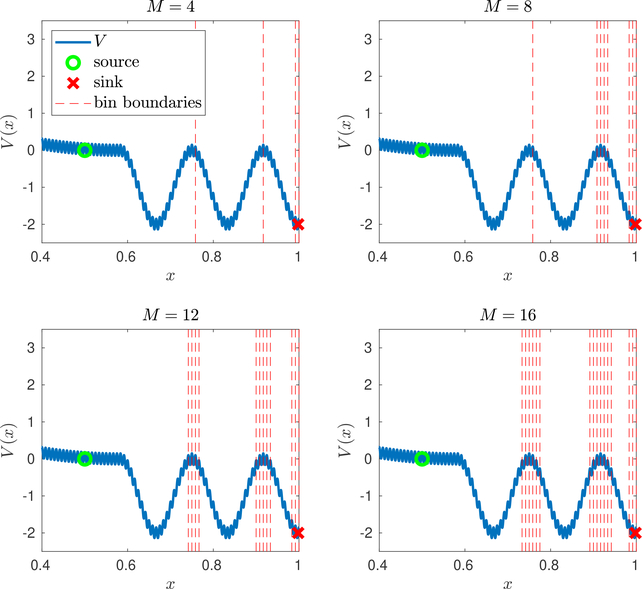
Fig. 6.2.
Increasing the value of M inAlgorithm 5.2. Plotted are weighted ensemble binscomputed usingAlgorithm 5.2with M = 4, 8, 12, 16. For each value of M, we use 106 iterations of Algorithm 5.2, with α tuned between 105 and 106. Note that with increasing M, additional bins are initially devoted to resolving the energy barrier between the two rightmost superbasins. Since the observable f is the rightmost microbin, this is the most important energy barrier for the bins to resolve. Note that the multiple adjacent small bins for M = 16 correspond to the steepest gradients of in the top right of Figure 6.1. All plots have been cropped at x > 0.4.

