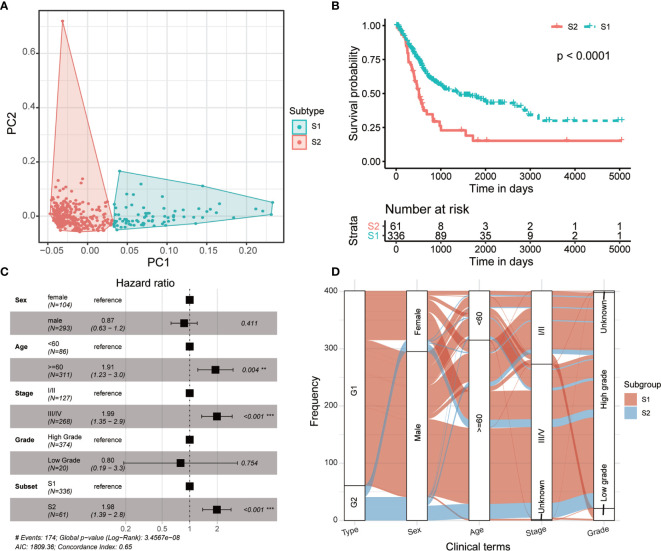
Figure 2.
Two prognostic subtypes of MIBC were classified using multi-omics data-based deep learning framework. (A) Principal component analysis shows two distinguished MIBC subgroups clustered by K-means algorithm. (B) Kaplan-Meier curves show a significant difference of overall survival between MIBC subtypes. (C) Forest plot shows the multi-variates cox regression analysis result using general clinical characters as well as the predicted MIBC subtypes. (D) Distribution of the MIBC subtypes in various clinical phenotypes.

