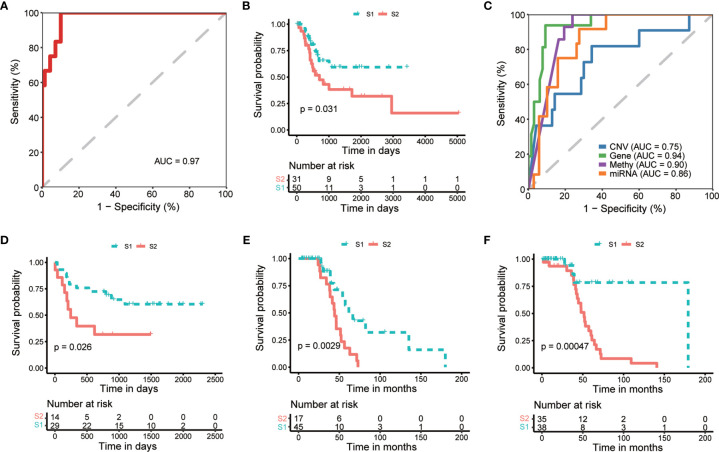
Figure 4.
Internal and external validation of prognostic subtyping. (A) ROC analysis shows the robustness of subgroup classification in internal testing dataset using multi-omics data. (B) Kaplan-Meier curves show a significant difference of overall survival between subtypes predicted by multi-omics data in internal testing dataset. (C) ROC analysis shows the robustness of subgroup classification in internal testing dataset using each single omics data, respectively. (D–F). Kaplan-Meier curves show a significant difference of overall survival between subtypes in external datasets, including GSE19915 (D) and two subsets of GSE48277 (E, F), respectively.

