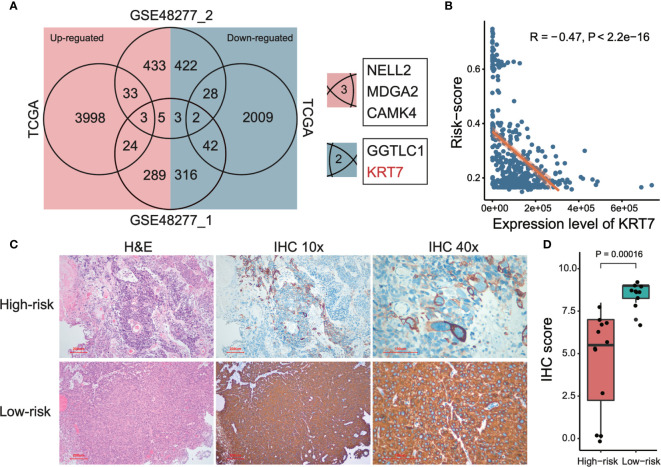
Figure 5.
Detection and validation of risk-related markers of MIBCs. (A) Venn plot shows the overlaps of differentially expressed genes among TCGA and two subsets of GSE48277. (B) Correlation between tumor risk score and expression level of KRT7. TCGA data was used to perform this analysis. Both Pearson correlation coefficient (R) and P-value were calculated. (C) Representative images of KRT7 IHC staining in different risk types and corresponding H&E staining. (D) KRT7 protein expression was significantly decreased in high-risk MIBC specimens compared with low-risk MIBC tissues by IHC. For the details of calculating IHC score, please see Materials and methods.

