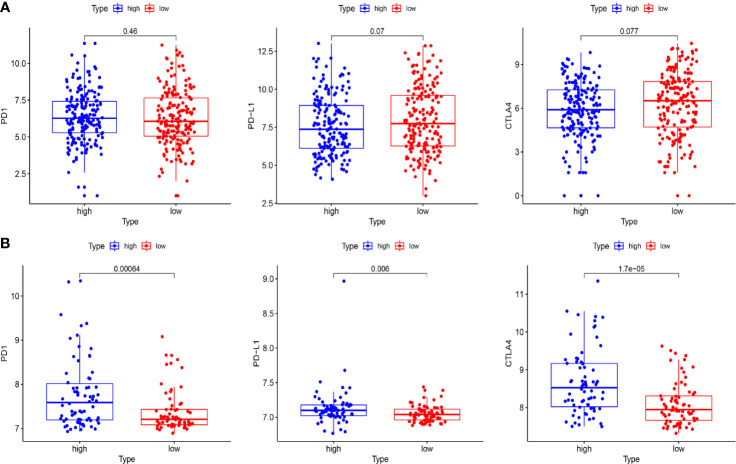
Figure 10.
The expression of immune checkpoint molecules including PD1, PDL1, and CTLA4 between the high-risk and the low-risk group in TCGA and GEO cohorts. (A) Box plots show the differences in the expression of PD1, PDL1, and CTLA4 between the high-risk and low-risk group in the TCGA cohort. (B) Box plots show the differences in the expression of PD1, PDL1, and CTLA4 between the high-risk and the low-risk group in the GEO cohort.

