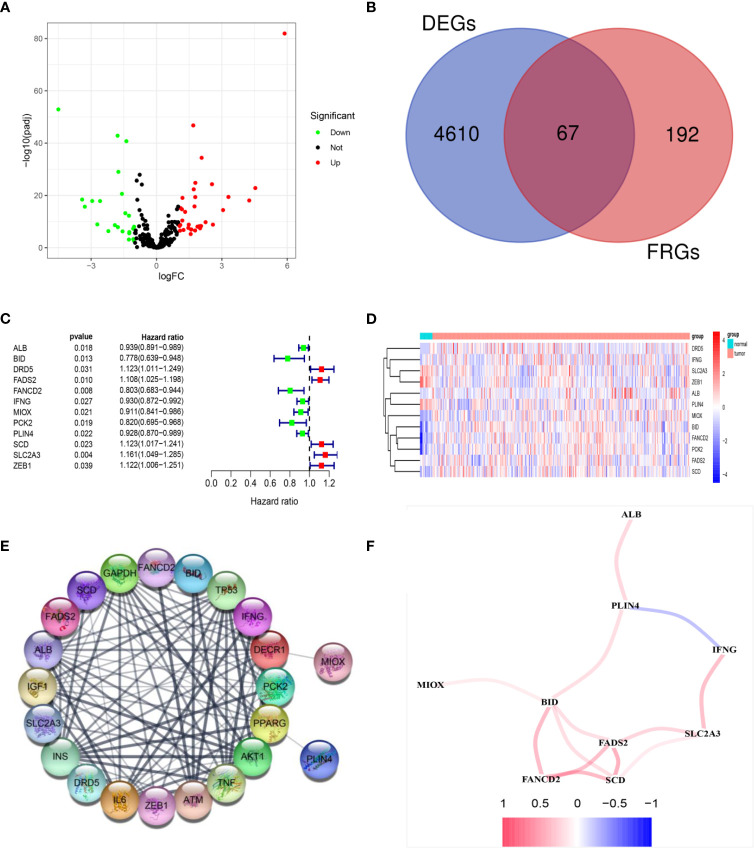
Figure 2.
Identification of prognostic DEGs related to FRGs in the TCGA cohort. (A) The 67 overlapping genes were shown in the volcano map. Forty genes were upregulated and 27 genes were downregulated in tumor tissues. (B) Venn diagram to identify DEGs related to FRGs. (C) Univariate Cox proportional regression analysis showed that the 12 genes were significantly associated with OS. (D) A heatmap showing the expressions of the 12 prognostic genes in the tumors and normal tissues. (E) PPI network provided interactive information among the candidate prognostic genes. (F) The correlation network of candidate genes. Different colors represented the correlation coefficients.

