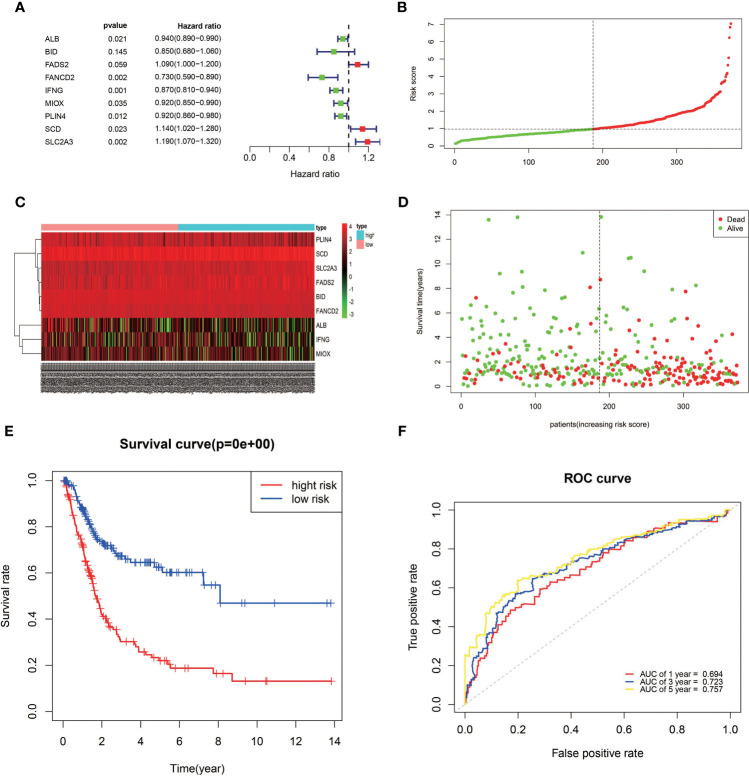
Figure 3.
Establishment of a prognostic model of FRGs in the TCGA cohort. (A) A nine-gene signature was generated by Multivariate Cox regression analysis. (B) Distribution of signature-based risk scores. (C) The differences in the expression of the prognostic signature in different risk groups. (D) Survival status of high-risk and low-risk patients. (E) Kaplan–Meier curves indicated that the OS in the high-risk group was markedly poorer than that in the low-risk group (p < 0.0001). (F) Time-dependent ROC curve analysis for measuring the prognostic performance of the signature-based risk score on OS.

