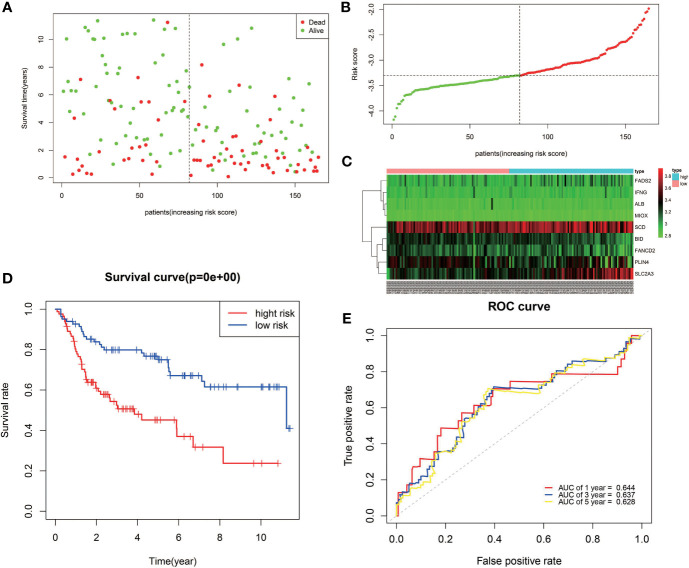
Figure 4.
Validation of the nine-FRG signature in the GEO cohort. (A) Survival status of high-risk and low-risk patients. (B) Distribution of risk scores. (C) The differences in the expression of the prognostic signature in different risk groups. (D) Kaplan–Meier curves for OS. (E) Time-dependent ROC curve analysis.

