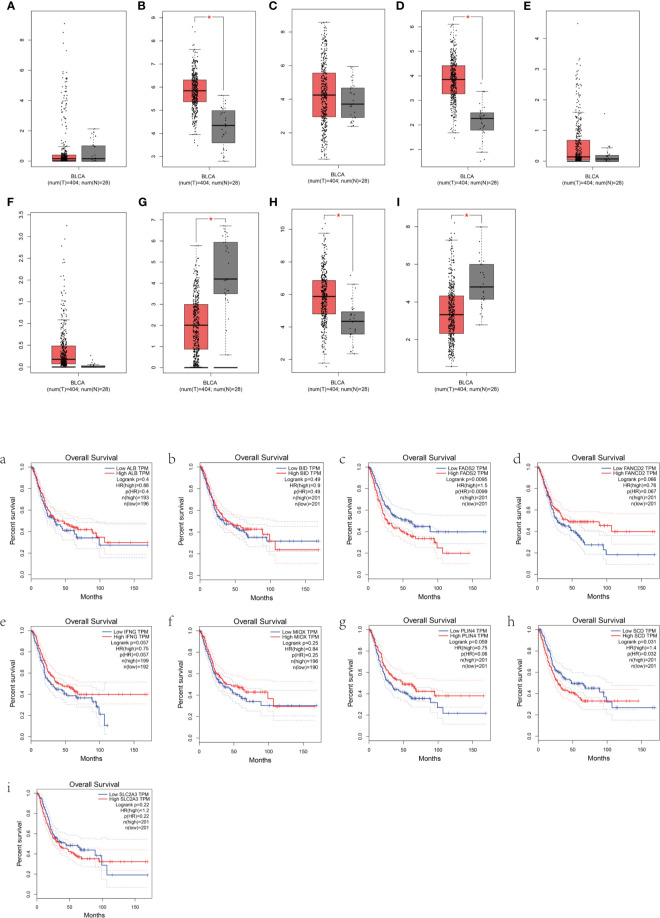
Figure 5.
Prognostic analysis of the BLCA patients based on the expression of FRGs. (A–I) Box plots show the differences in the expression of nine different ferroptosis-related genes in the tumor and normal tissues from the GEPIA dataset. (a–i) The overall survival of BLCA patients based on the expression of the nine FRGs is shown.

