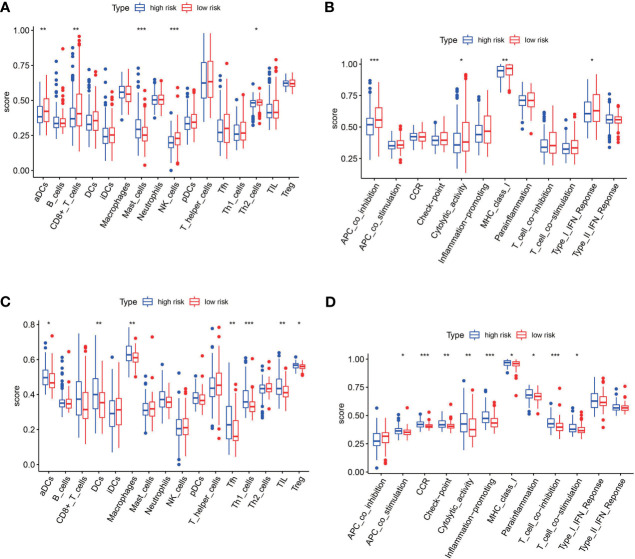
Figure 9.
The single-sample gene set enrichment analysis (ssGSEA) scores between the high-risk and low-risk group in TCGA and GEO cohorts. (A) Box plots showing the scores of 16 immune cells in different groups in the TCGA cohort. (B) Box plots showing the scores of 13 immune-related functions in different groups in the TCGA cohort. (C) Box plots showing the scores of 16 immune cells in different groups in the GEO cohort. (D) Box plots showing the scores of 13 immune-related functions in different groups in the GEO cohort. Adjusted p-values are shown as follows: *p < 0.05; **p < 0.01; ***p < 0.001.

