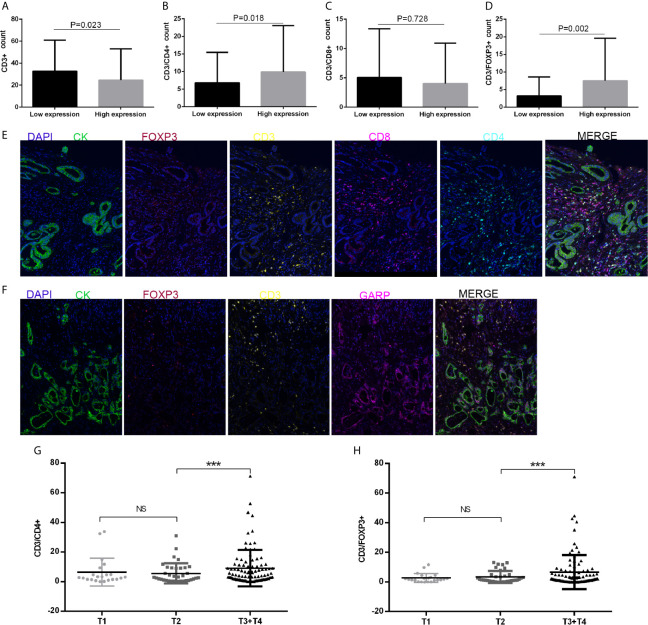
Figure 3.
(A–D) CD3+ T cell, CD4+ T cell, CD8+ T cell, and FOXP3+ regulatory T cell (Treg) infiltration levels in patients with low or high glycoprotein A repetitions predominant (GARP) expression. (E, F) Representative fluorescence-based multiplex immunohistochemistry images. (E) A staining panel was developed to visualize CD3, CD4, CD8, FOXP3, and CK simultaneously on the same tissue slide. (F) A staining panel was developed to visualize CD3, GARP, FOXP3, and CK simultaneously on the same tissue slide. (G, H) Tumor size (T) was associated with changes in CD4+ T cell and FOXP3+ Treg infiltration. Ns, P > 0.05; ***, P < 0.001.

