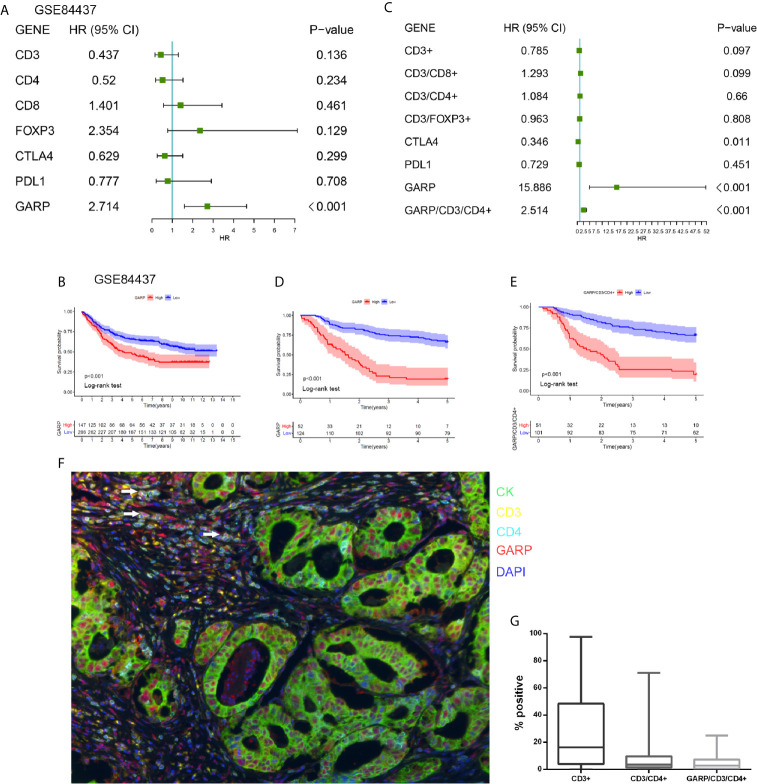
Figure 4.
(A) A forest plot visualizing the impact of the immune microenvironment (TME)-associated signatures and GARP on overall survival (OS) in the GSE84437, as evaluated using Cox univariate tests. (B) Kaplan–Meier curve for the high and low expression groups in the GSE84437. (C) A forest plot visualizing the impact of the immune microenvironment (TME)-associated signatures and GARP on overall survival (OS) in our cohort, as evaluated using Cox univariate tests. (D) Kaplan–Meier curve for the high and low expression groups in our cohort. (E) Kaplan-Meier plot visualizing survival associations of GARP+CD4+ T cell. The optimal cutoff point was obtained from X-tile 3.6.1 software. (F) Representative fluorescence-based multiplex immunohistochemistry images of the rate of positivity for GARP+CD4+ T cell in tissue microarray sections. (G) A plot shows the rate of positivity for CD3+ T cell, CD4+ T cell, and GARP+ CD4+ T cell. White arrows in the picture that point to the GARP+CD4+ cells.

