FIGURE 3.
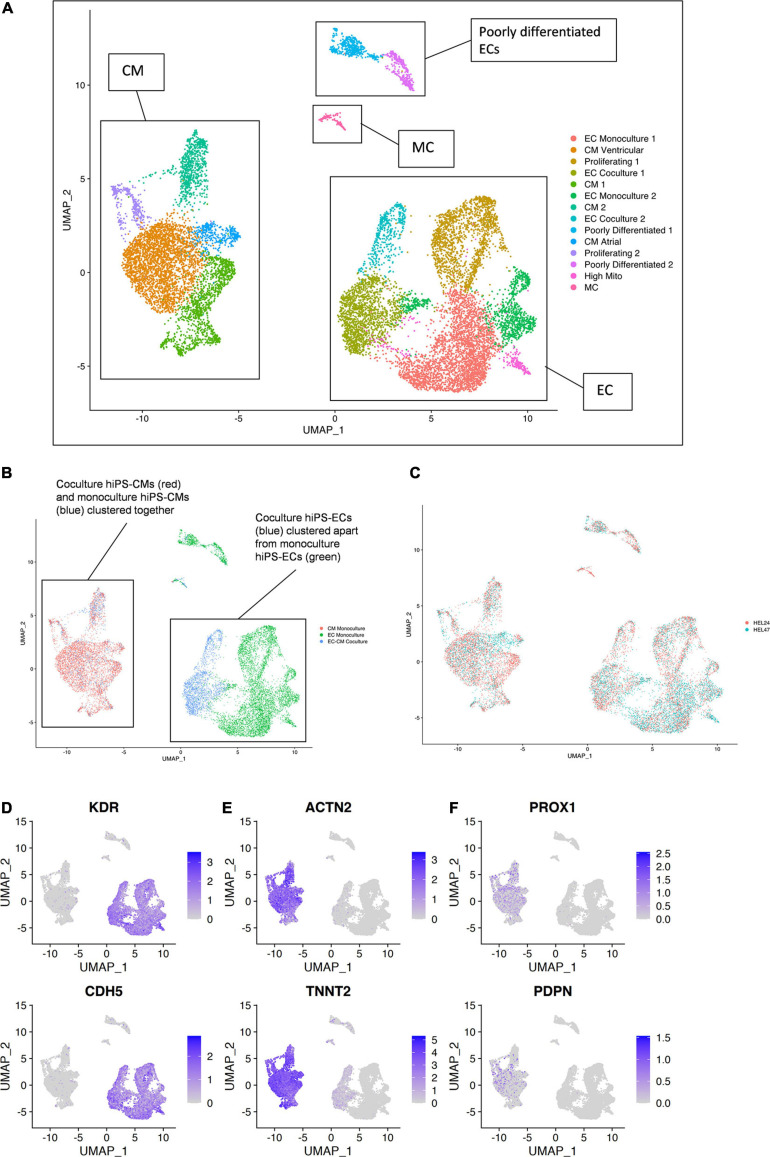
Single-cell transcriptome of six combined samples [(1) HEL24.3 hiPS-EC monoculture, (2) HEL24.3 hiPS-CM monoculture, (3) HEL24.3 co-culture of hiPS-CMs and hiPS-ECs, (4) HEL47.2 hiPS-EC monoculture, (5) HEL24.3 hiPS-CM monoculture, and (6) HEL47.2 co-culture of hiPS-CMs and hiPS-ECs]. (A) Uniform Manifold Approximation and Projection (UMAP) plot of delineated clusters. Endothelial cells (EC), cardiomyocytes (CM), mesenchymal cells (MC), and poorly differentiated ECs have been highlighted. (B) The same UMAP plot according to cell culture conditions [(1) hiPS-EC monoculture (green), (2) hiPS-CM monoculture (red), and (3) hiPS-EC/hiPS-CM co-culture (blue)]. (C) The same UMAP plot according to cell line (1) HEL24.3 (salmon), and (2) HEL47.2 (skyblue). Feature plots on the expression of (D) vascular endothelial markers (E) cardiomyocyte markers (F) lymphatic endothelial cell markers.

