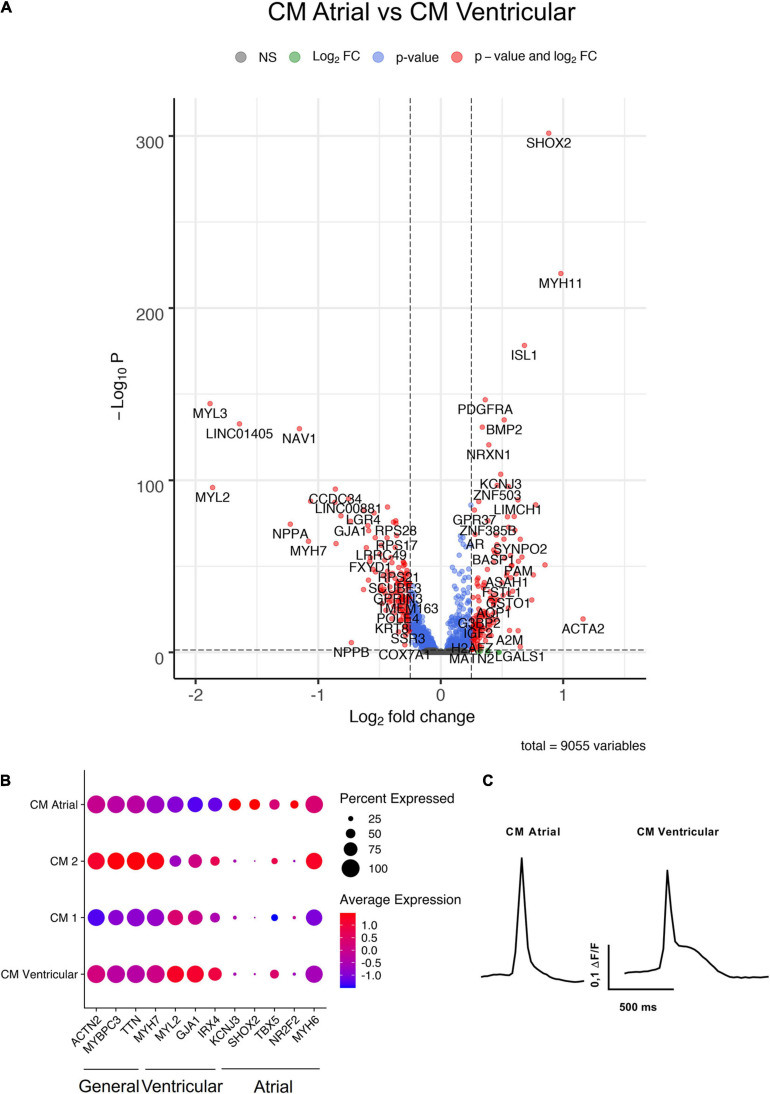
FIGURE 4.
Characterization of hiPS-CM clusters. (A) Volcano plot of altered genes in atrial type hiPS-CMs (CM Atrial-cluster) compared to ventricular type hiPS-CMs (CM Ventricular-cluster). (B) Expression of general CM genes, atrial CM, and ventricular CM genes in the four hiPS-CM clusters. (C) Representative action potential morphologies of atrial and ventricular hiPS-CMs. All scRNAseq data presented in the figure consists of combined data from HEL47.2 and HEL24.3 lines.

