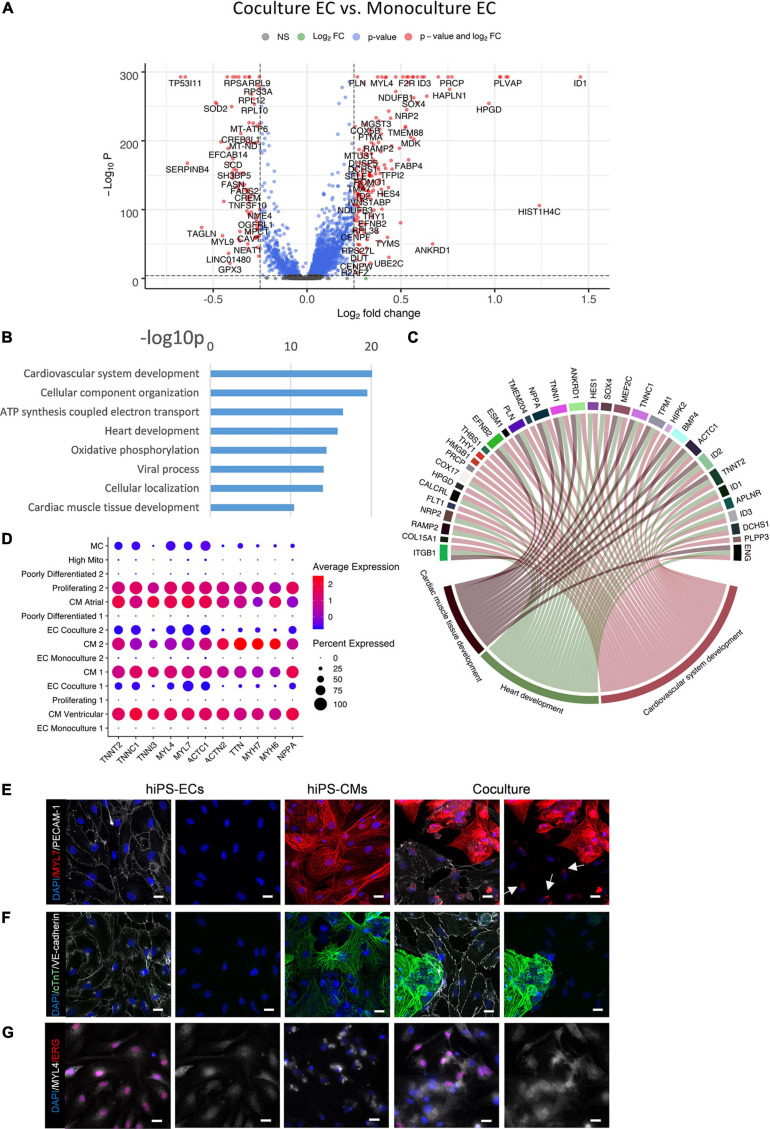
FIGURE 5.
Comparison of co-culture and monoculture hiPS-ECs. (A) Volcano plot of altered genes in co-culture hiPS-ECs compared to monoculture hiPS-ECs. (B) GO-analysis on differentially expressed genes that are upregulated (log fold change > 0.10 fdr < 0.01) in co-culture hiPS-EC’s–eight representative categories are presented. (C) Upregulated genes in relevant GO categories (genes with log fold change > 0.25). (D) Expression of cardiac contractility genes and cardiac secreted protein NPPA coding gene in all clusters. (E) Immunofluorescence staining of MYL7 in monoculture hiPS-ECs, monoculture hiPS-CMs, and hiPS-EC/hiPS-CM co-culture (scale bar 20 μm). (F) Immunofluorescence staining of cTnT in monoculture hiPS-ECs, monoculture hiPS-CMs, and hiPS-EC/hiPS-CM co-culture (scale bar 20 μm). (G) Immunofluorescence staining of MYL4 in monoculture hiPS-ECs, monoculture hiPS-CMs, and hiPS-EC/hiPS-CM co-culture (scale bar 20 μm). All scRNAseq data presented in the figure consists of combined data from HEL47.2 and HEL24.3 lines. White arrows indicate MYL7 staining in hiPS-ECs.

