
Figure 5.
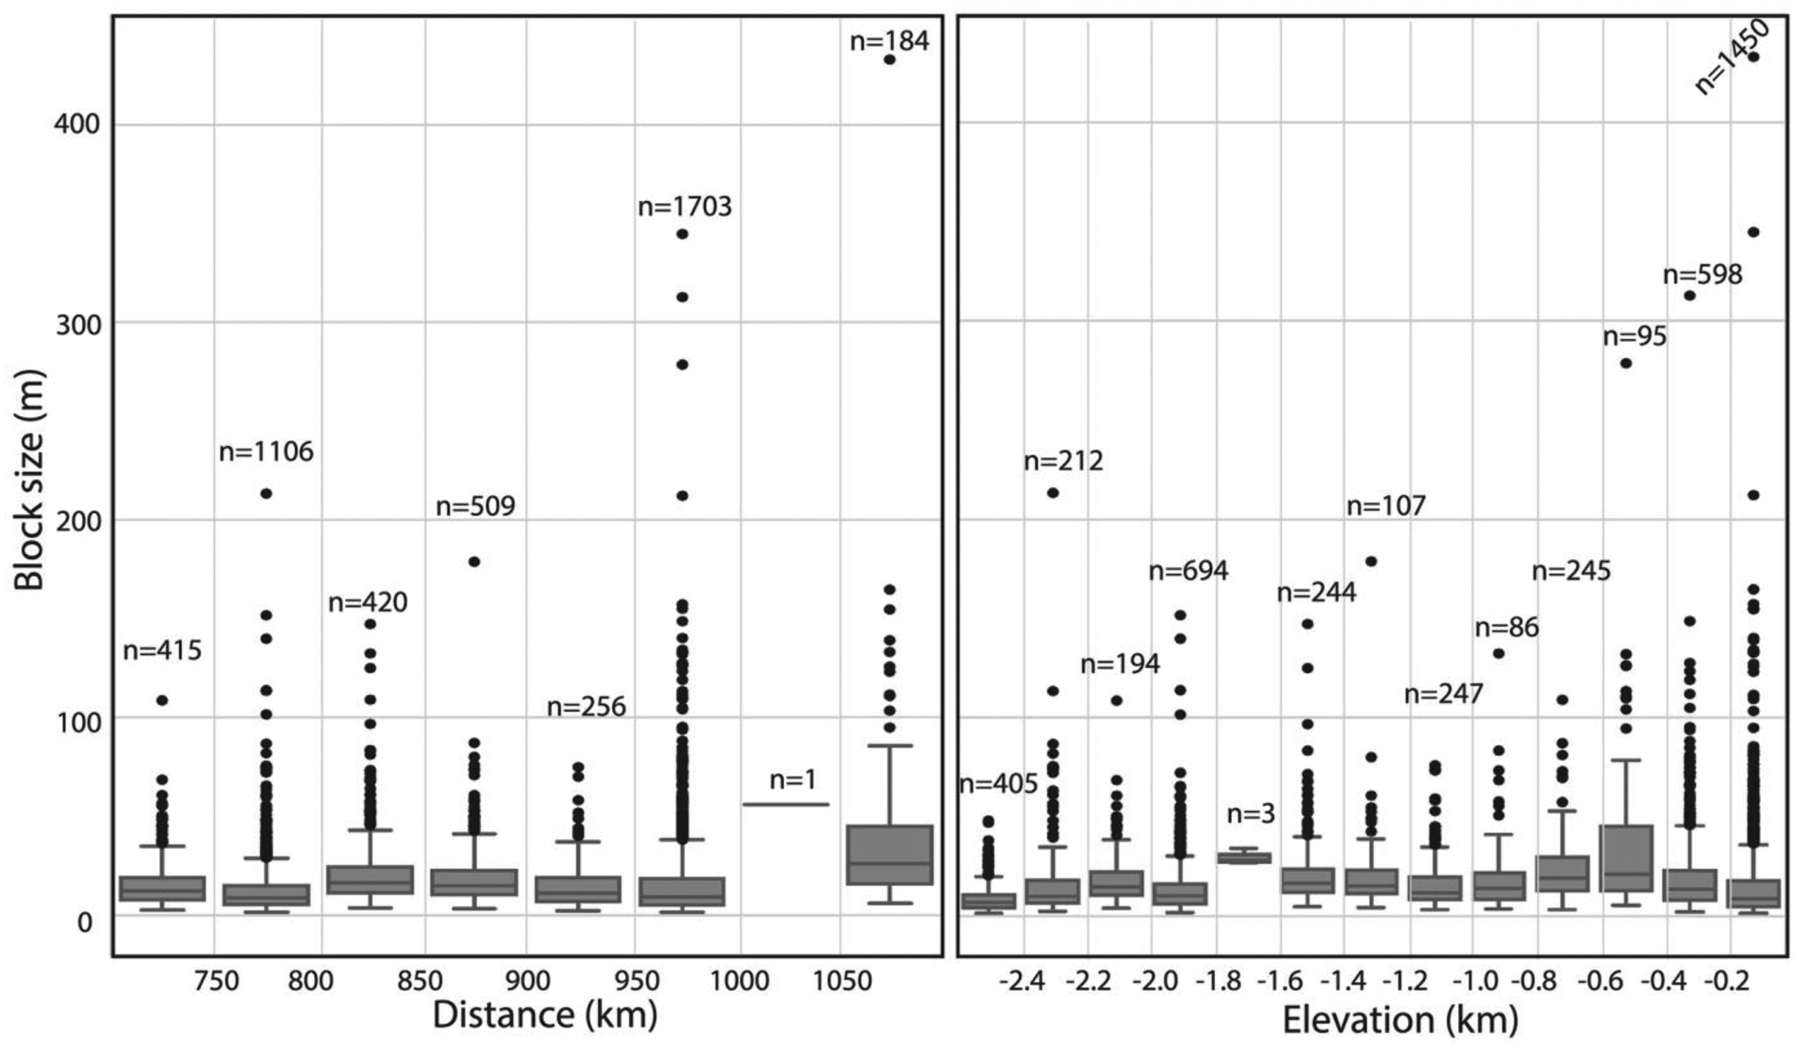
Boxplots of 4,600 megabreccia block sizes within each distance and elevation bin. The gray box encompasses the interquartile range (IQR) including the 25th (Q1) and 75th percentiles (Q3). The black line in the box indicates the median. Whiskers show lower (Q1–1.5 × IQR) and upper (Q3 + 1.5 × IQR) range of boxplots. Gray dots show all megabreccia points outside the lower and upper range. The number of megabreccia within each bin is denoted above each boxplot. Note that certain bins at 1,000–1,050 km and elevation of −1.8 to −1.6 km have too few megabreccia to construct proper boxplots and may be disregarded.