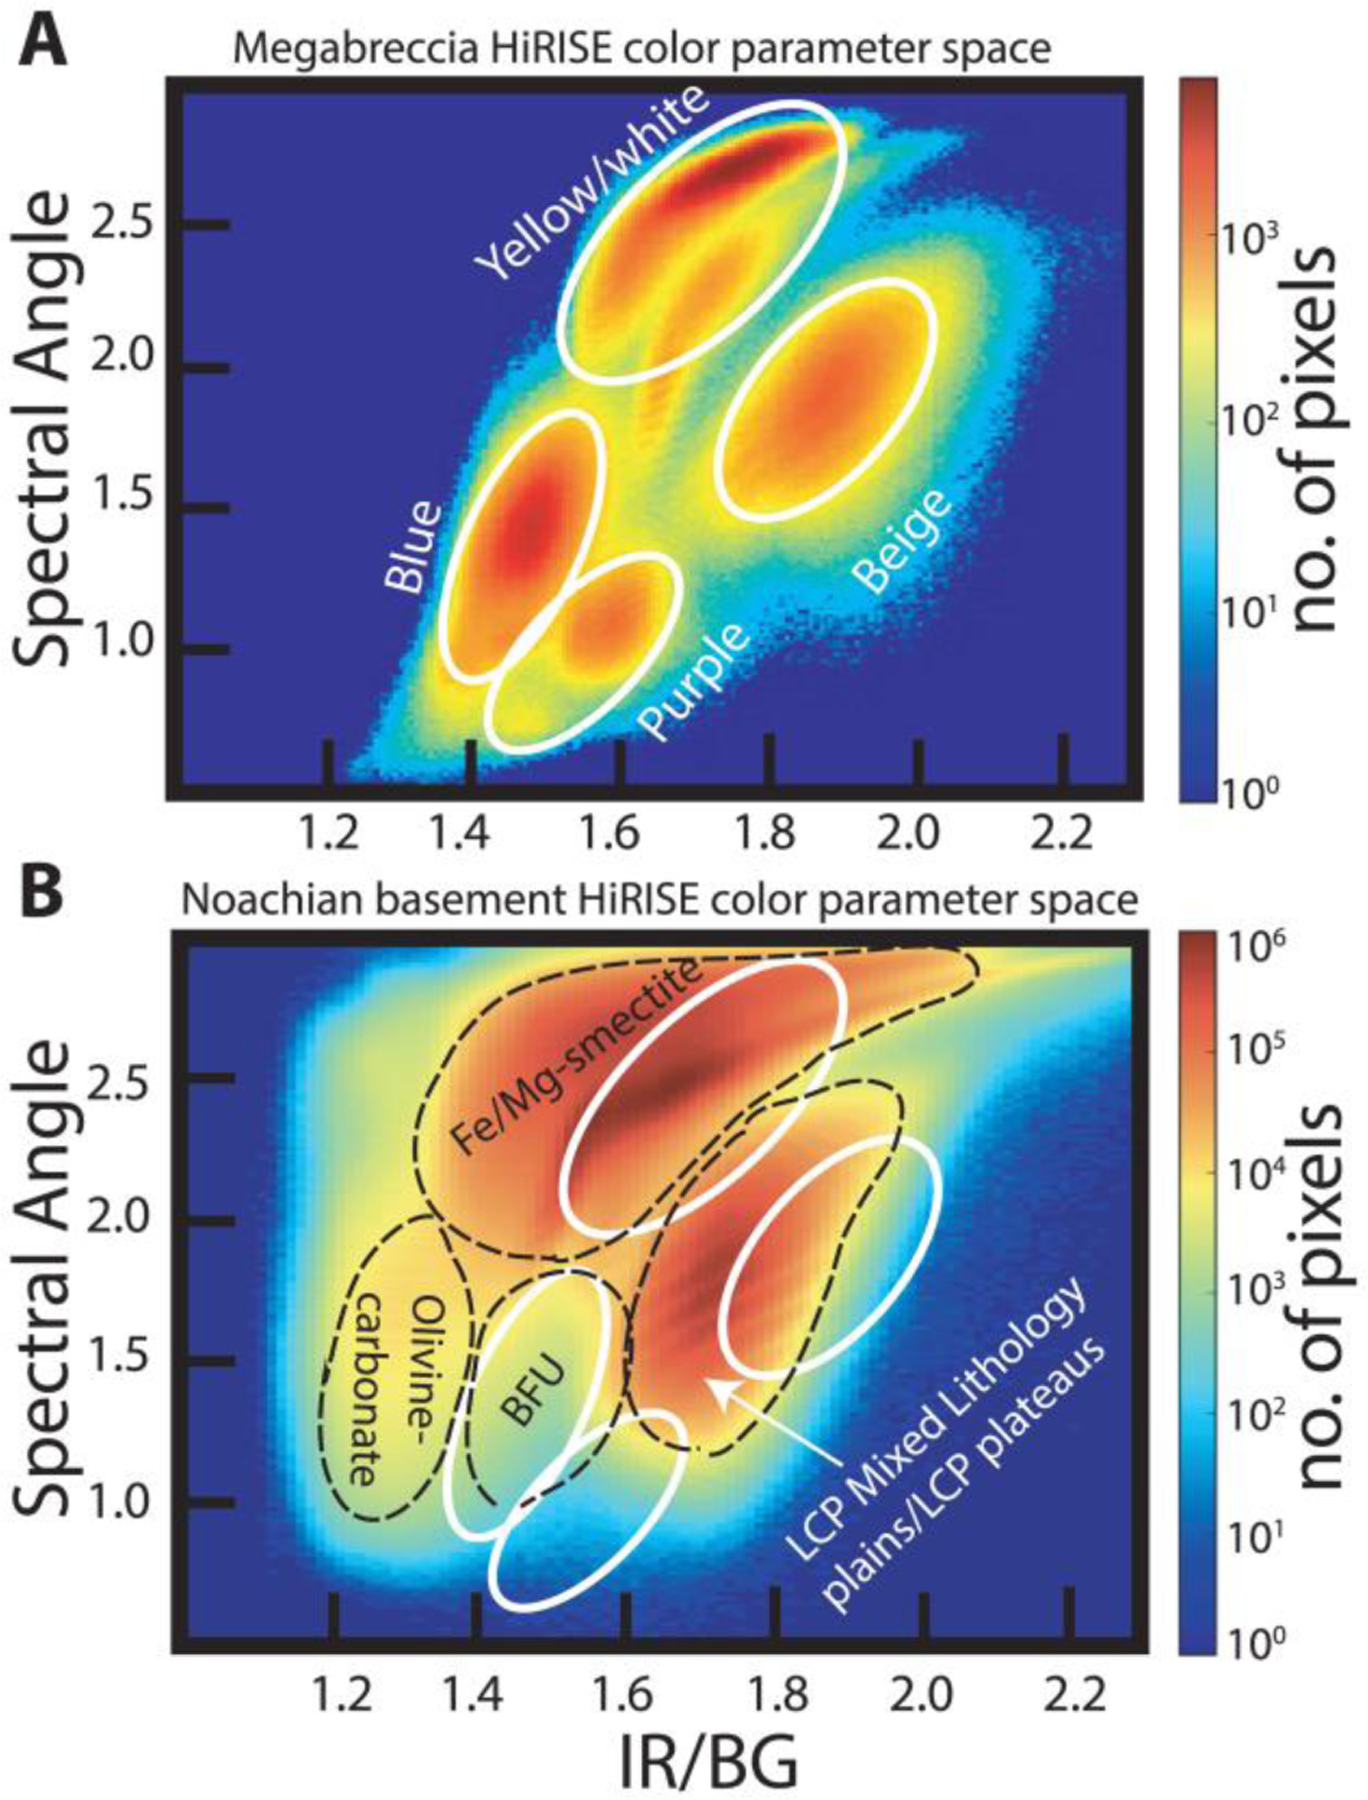
Figure 6.

(a) The 2-D histogram of IR/BG band ratio and spectral angle from HiRISE color parameterization scheme from Figure 2. Data include only megabreccia blocks from eight different images that each contained a variety of different colored clasts. The megabreccia HiRISE color parameter space shows four main lithological clusters (white lines) that correlate with yellow/white, blue, beige, and purple visual colors from Figure 2. HiRISE images used are ESP_016153_2005, ESP_022601_1975, ESP_033572_1995, ESP_037185_2010, ESP_037541_2010, ESP_047049_2015, ESP_047339_1980, and PSP_002888_2025. (b) The 2-D histogram of IR/BG band ratio and spectral angle from entire HiRISE images containing Noachian Basement and olivine-carbonate units. Here, clusters (black stippled lines) were related to olivine-carbonate, Blue Fractured Unit (BFU), general Fe/Mg-smectite signatures in CRISM, and LCP-bearing Mixed Lithology Plains Unit and/or LCP-bearing Plateaus Unit. HiRISE images used are a portion of ESP_016153_2005, ESP_027691_2025, ESP_047049, and ESP_053655_1985.
