
Figure 7.
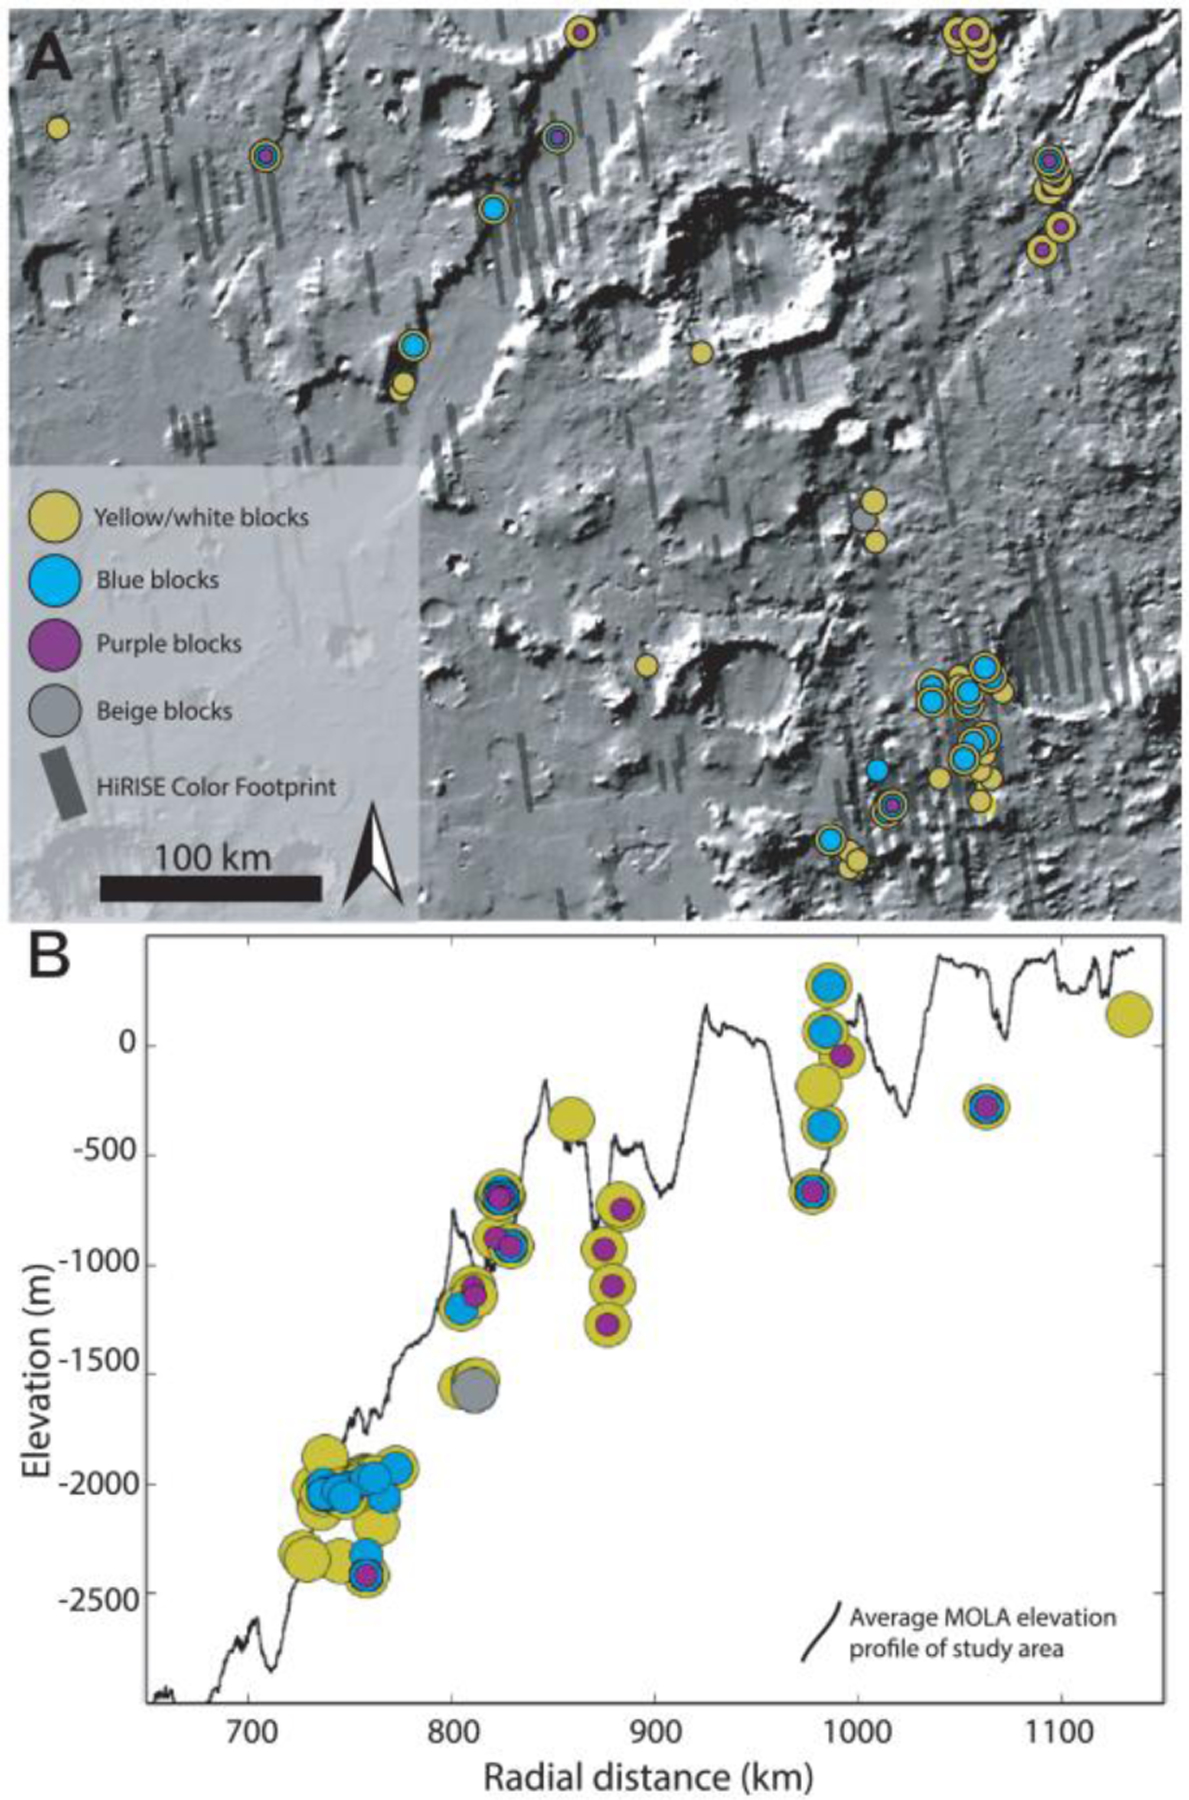
(a) Megabreccia outcrops of different visual HiRISE color (yellow/white, blue, purple, and beige colors) properties plotted in plan view with MOLA hillshade background. Outcrops with multiple colored circles represent outcrops that include blocks of multiple color properties. HiRISE color footprints in dark gray. (b) Megabreccia outcrops of different color properties plotted by radial distance and MOLA elevation. Outcrops with multiple colored circles represent outcrops that include blocks of multiple color properties. The black line in the background represents the average MOLA elevation profile of the study area.