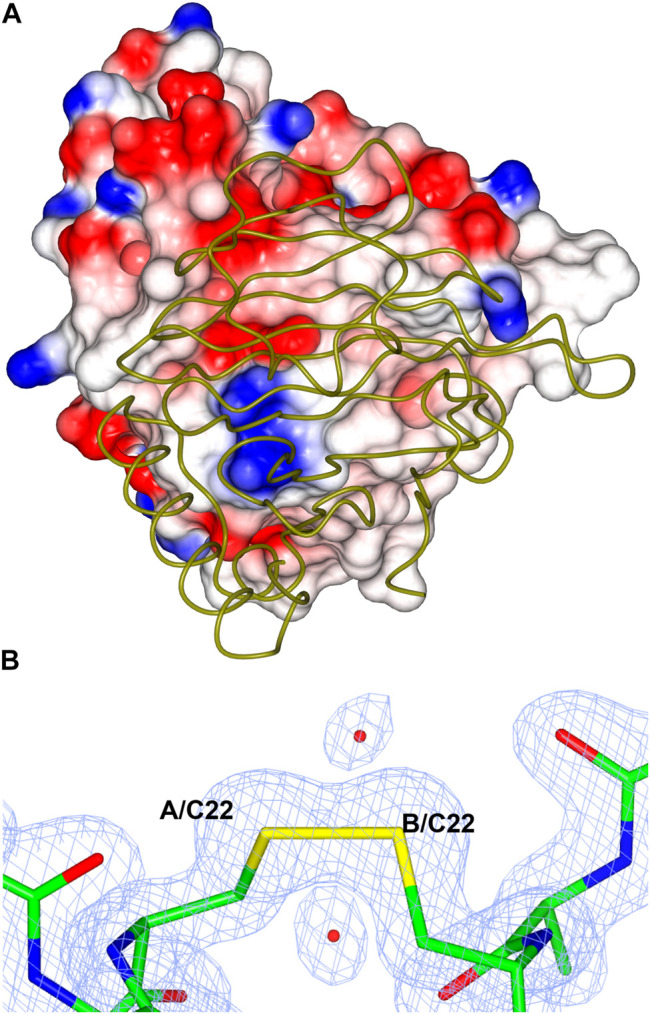
FIGURE 12.

(A) A cartoon diagram showing the hydrophobic interactions at the dimer interface of TsLI. The electrostatic surface potential of one monomer of TsLI that has been rotated by 90° around the vertical axis from that presented in Figure 7 is shown together with the other monomer of the dimer shown as an α-C backbone (green). The areas of positive charge are shown in blue, with the areas of negative charge in red and the hydrophobic surfaces are represented in white. (B) Detail of the electron density showing the intersubunit disulfide bond formed by the cysteine 22 of each monomer. The 2Fo—Fc (blue) is contoured at 1.3 σ and the Fo—Fc map is contoured at 3.0 σ (green) and −3.0 σ (red).
