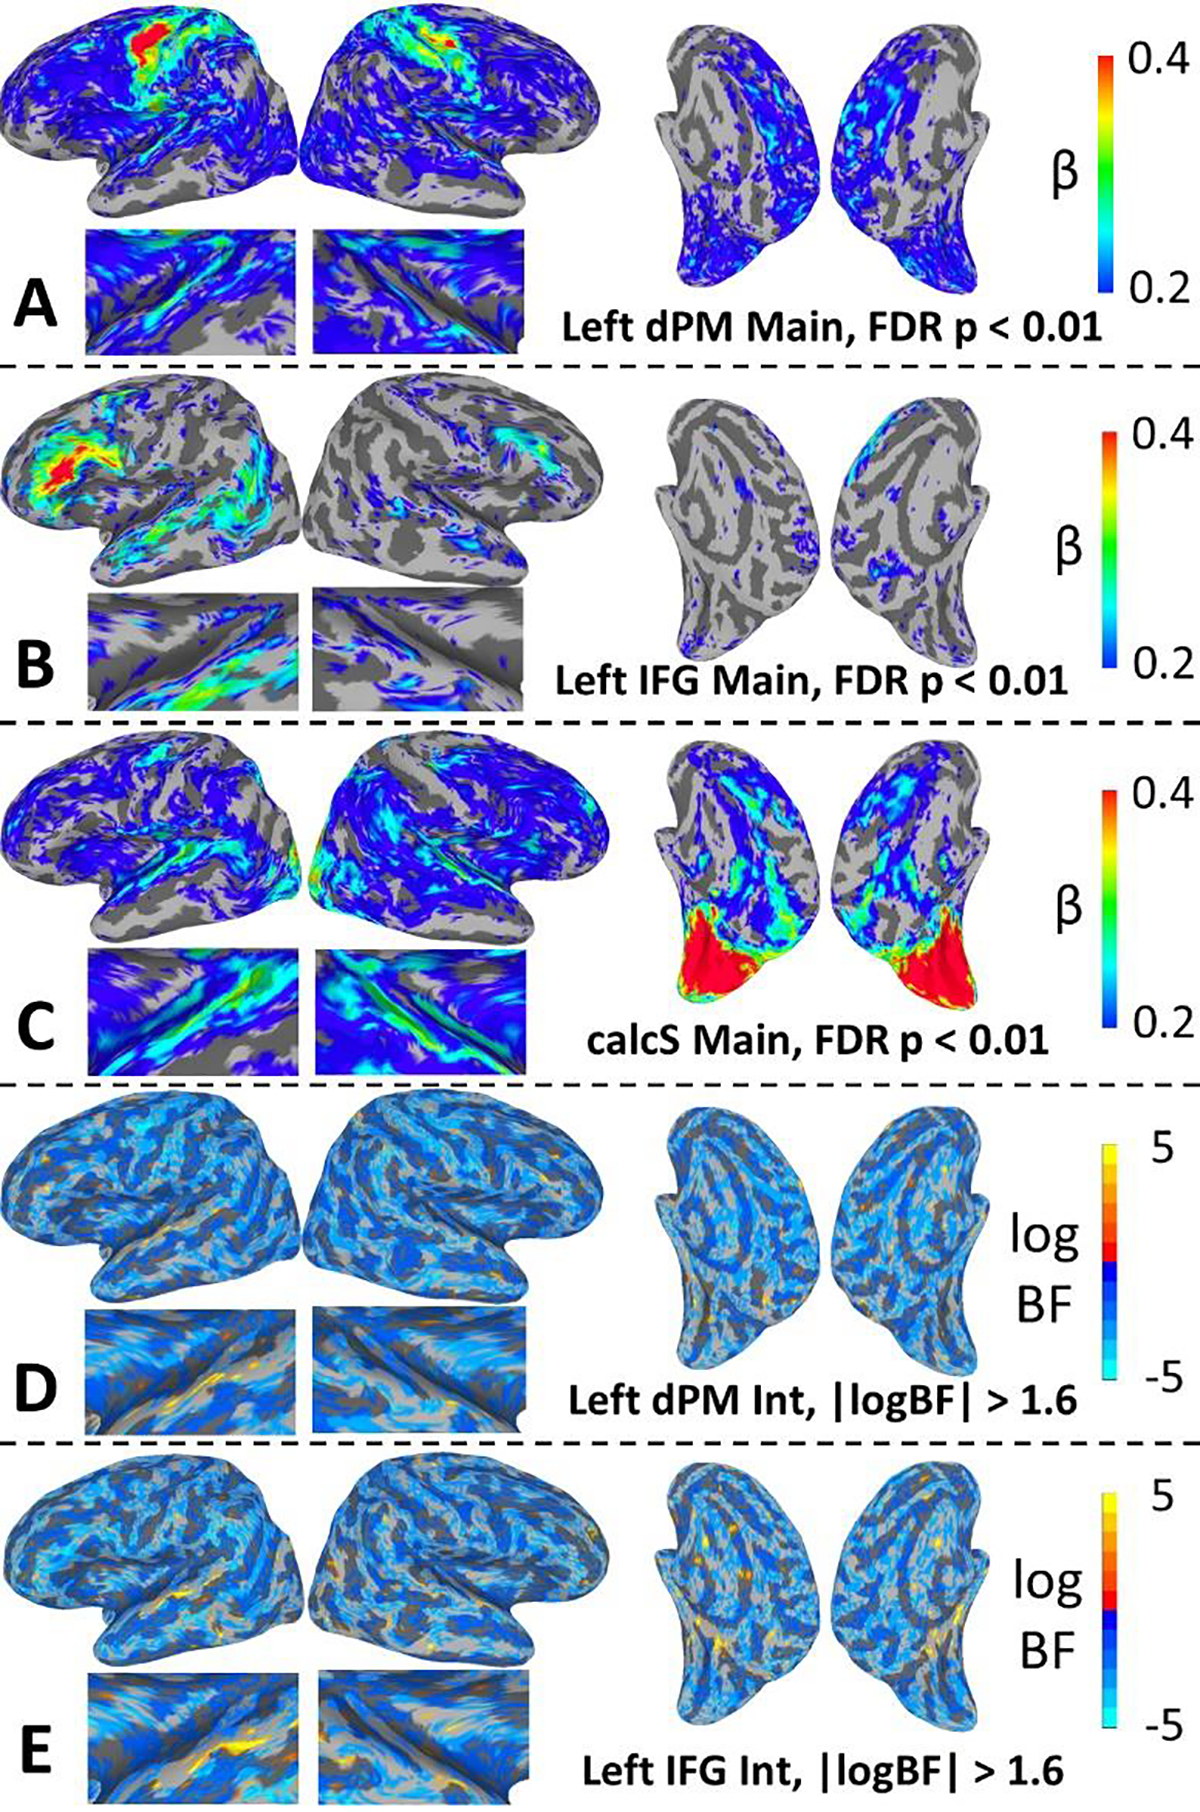
Figure 5.

(A-C) Maps show the average regression coefficient (β) for the main effect of seed connectivity (two-way, FDR-corrected p < 0.01). Note the color scale: nearly all (>99%) significant effects were positive; the color scale was selected to allow visualization of the full range of these positive effects across brain regions. That is, both cool and warm colors denote positive functional connectivity. (D-E) Maps show the log Bayes Factor for the intelligibility-by-seed-connectivity interaction (thresholded at |logBF| > 1.6). Negative values (cool colors) indicate support for the null hypothesis (no interaction) and positive values indicate support for the alternative hypothesis (interaction present). Plots zoomed on the auditory cortex are shown beneath the lateral surface plots. All plots use a standard topology inflated surface derived from the Colin N27 template in MNI space.
