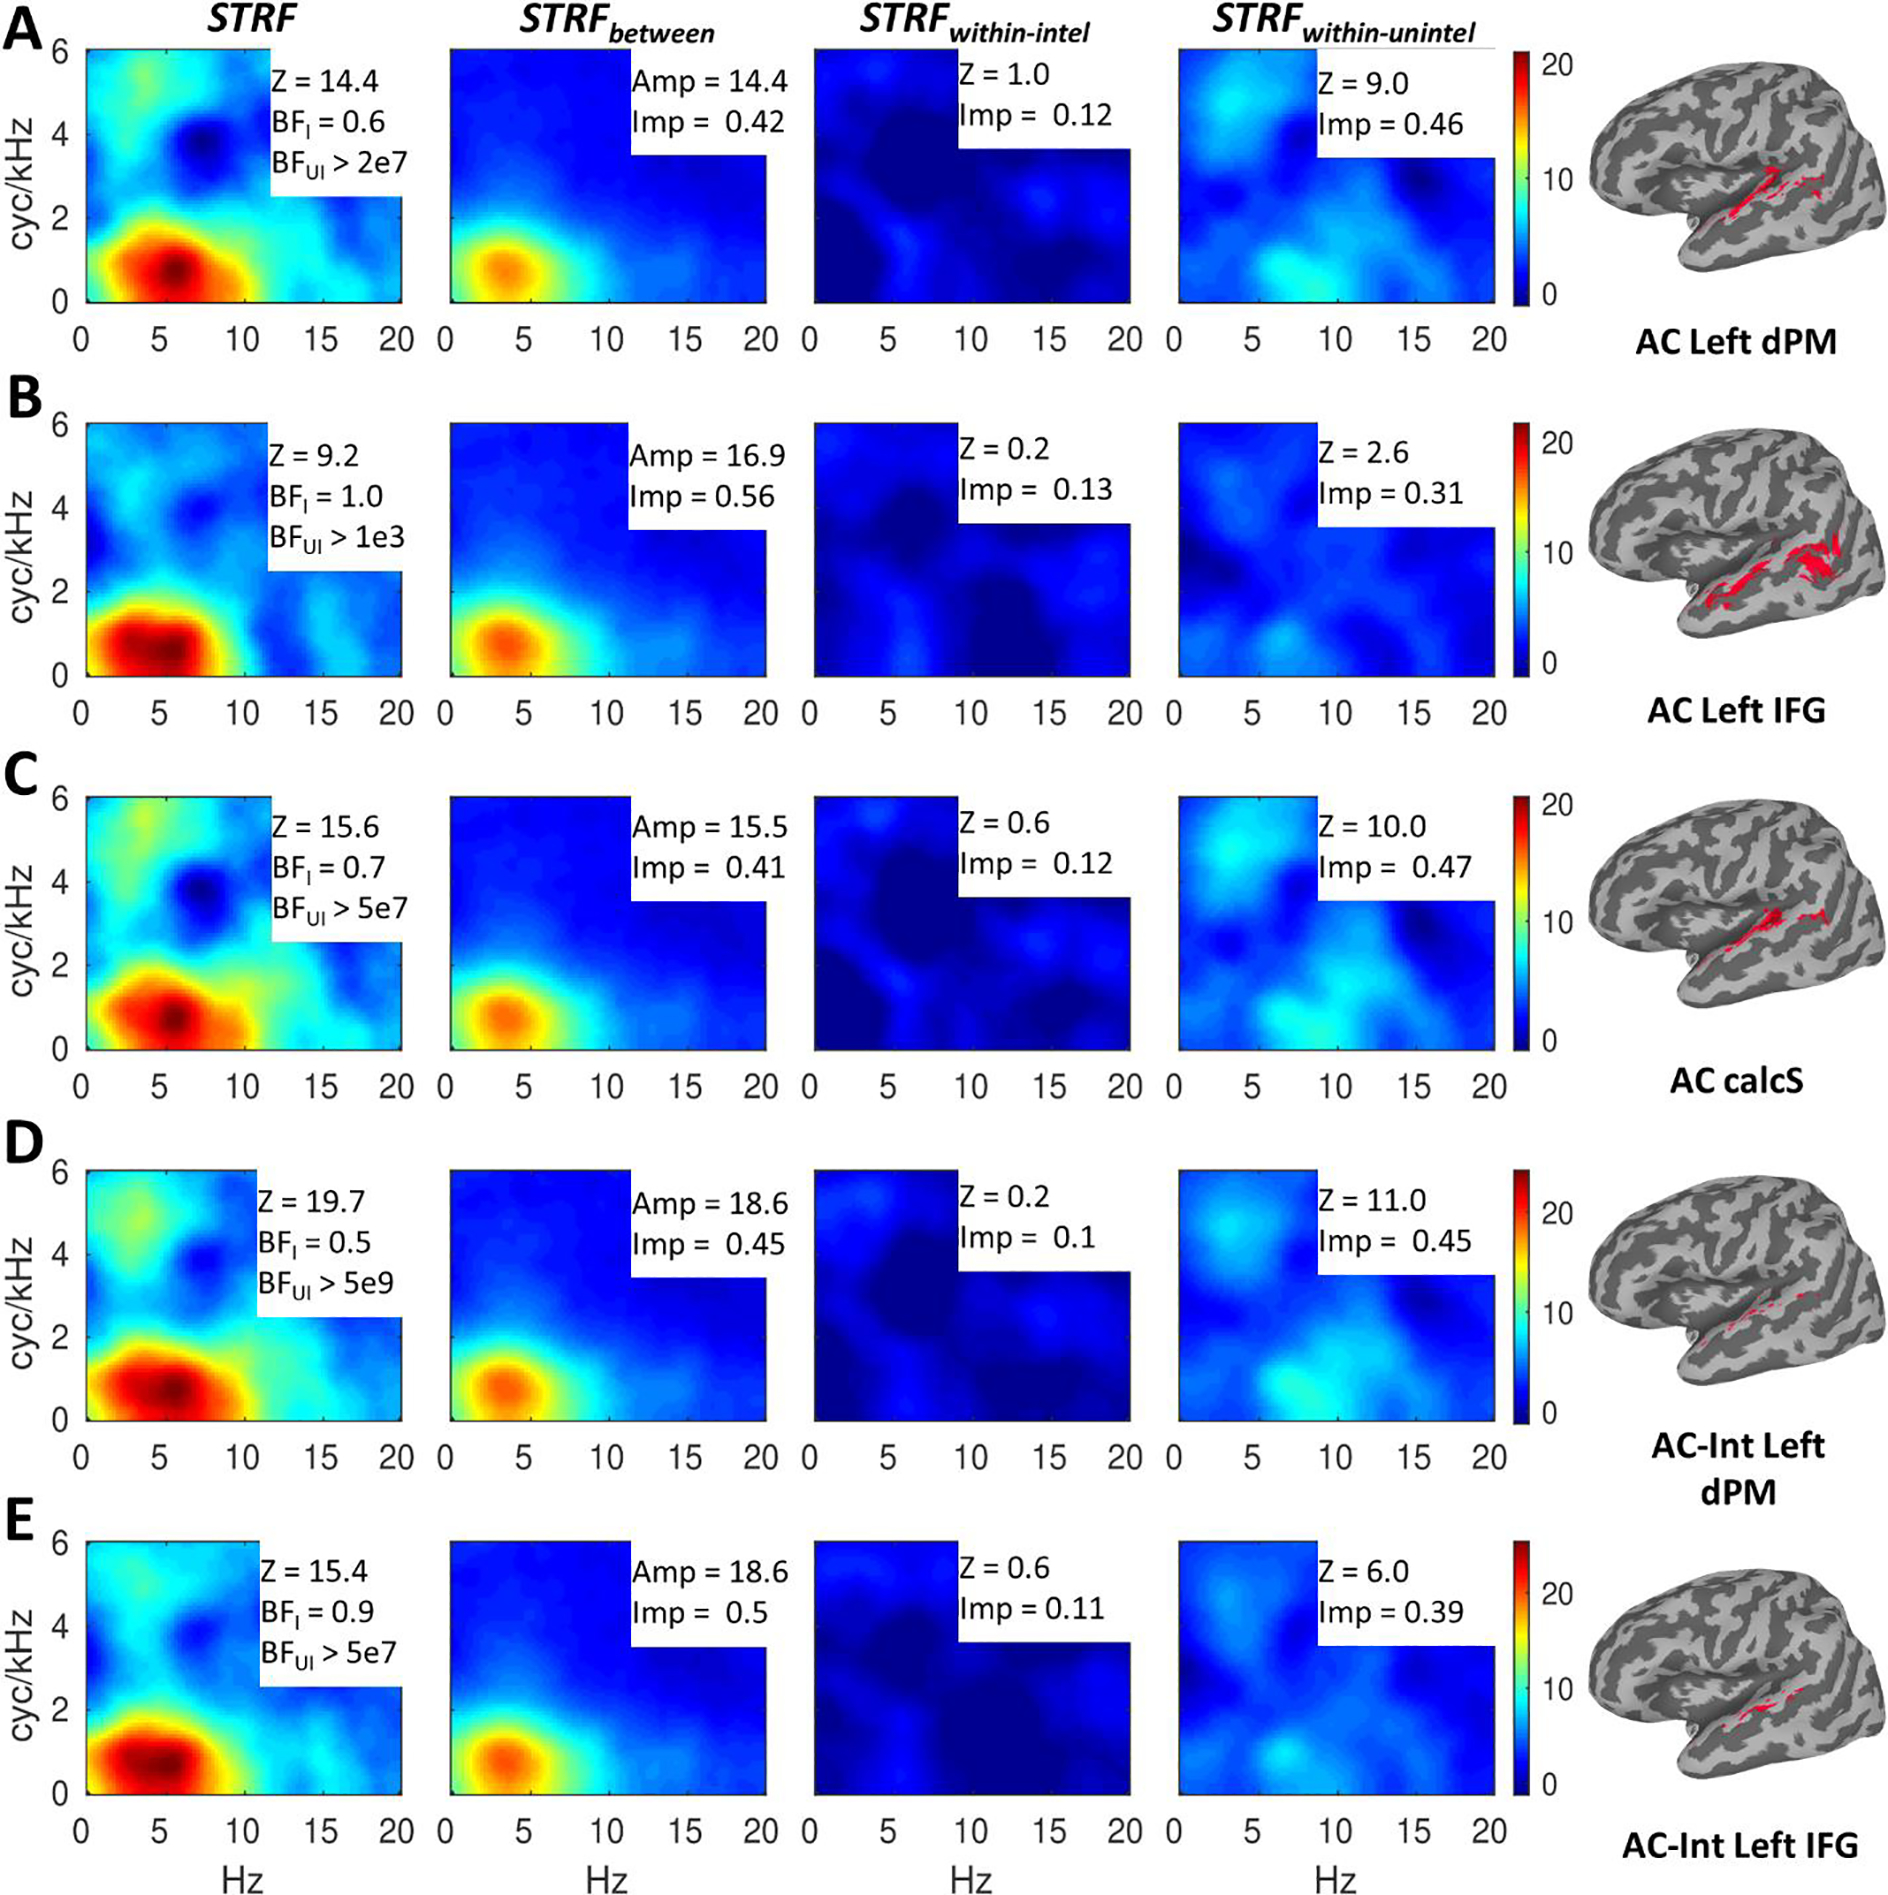
Figure 6.

Speech-driven STRFs in auditory regions defined by functional connectivity with non-auditory regions. A row (A-E) is dedicated to each auditory region (right insets: region mask displayed on inflated standard topology surfaces and labeled with the corresponding seed region). Regions defined by the main effect of seed connectivity (A-C) are labeled as ‘AC’ and regions defined by the interaction of seed connectivity with speech intelligibility (D-E) are labeled as ‘AC-Int.’ Overall responses (STRF) are shown in the first column, while effects of intelligibility (STRFbetween) and responses within intelligible (STRFintel) and unintelligible (STRFunintel) trials are shown in the second through fourth columns, respectively. For each region (A-E), the color scale is based on the overall STRF min/max and applied to each of the decomposed STRFs at right to allow a visualization of the relative contribution of each component STRF to the overall STRF. The overall STRFs are annotated with second-level alignment strength (Z) and Bayes Factors (geometric mean across surface nodes) indicating quality of LOO predictions within intelligible (BFI = BFintel) and unintelligible (BFUI = BFunintel) trials. The decomposed STRFs are annotated with the max amplitude (Amp; STRFbetween) or second-level alignment strength (Z; STRFintel and STRFunintel) and the proportional relative importance (Imp).
