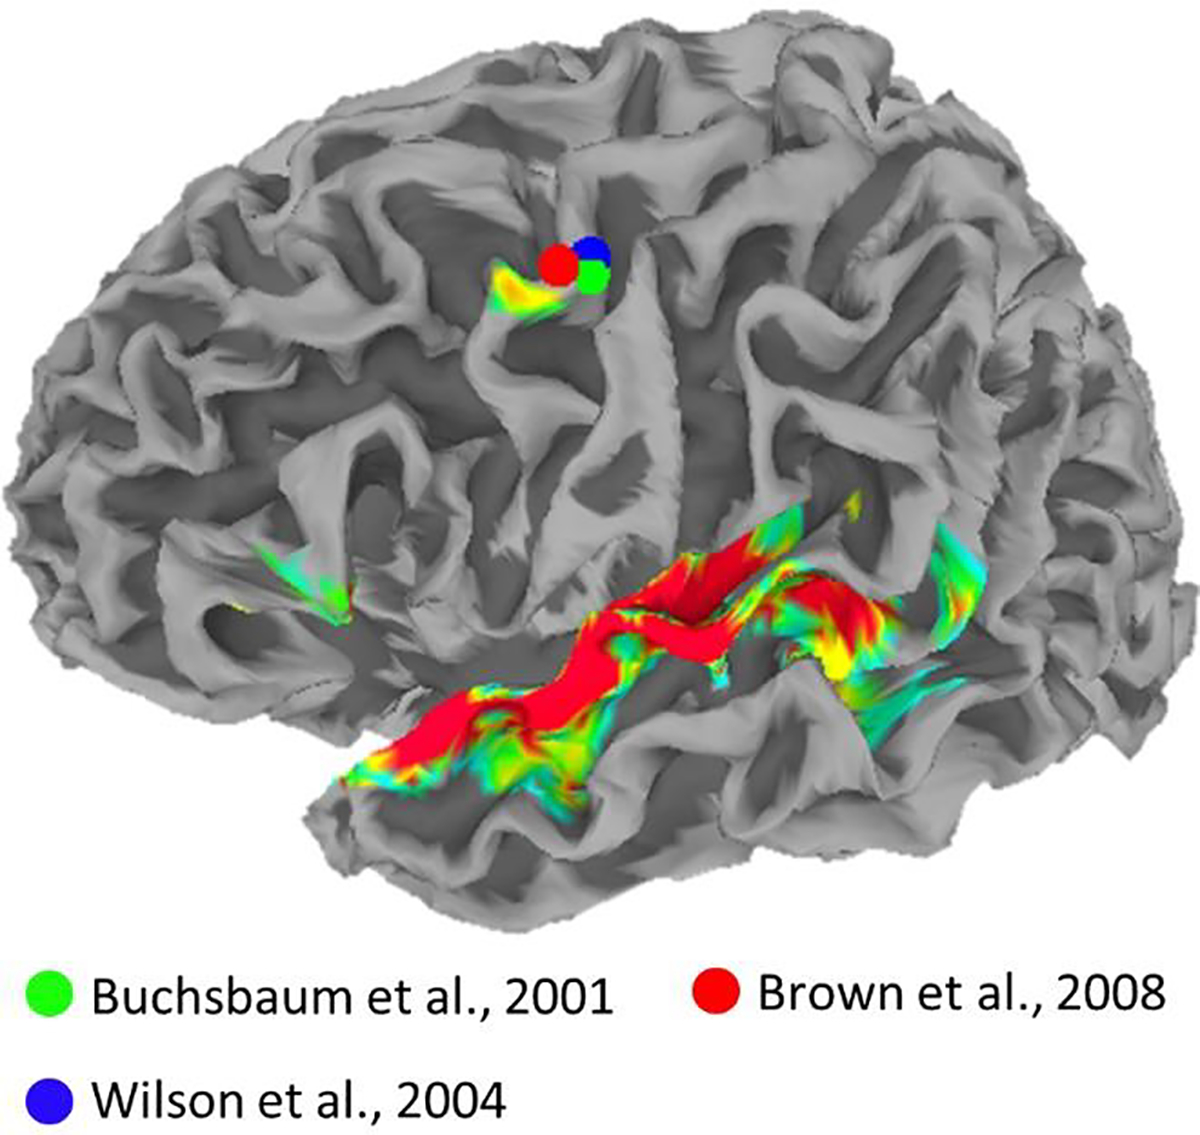
Figure 7.

Heatmap is a replication of Figure 4A. Spheres show peak dorsal premotor coordinates from previous studies showing activation during sensory and motor speech tasks (Buchsbaum et al., 2001, green; Wilson et al., 2004, blue) and during laryngeal motor tasks (Brown et al, 2008, red). Plots are overlaid on the standard topology white-matter-boundary surface derived from the Colin27 template in MNI space.
