
Figure 4.
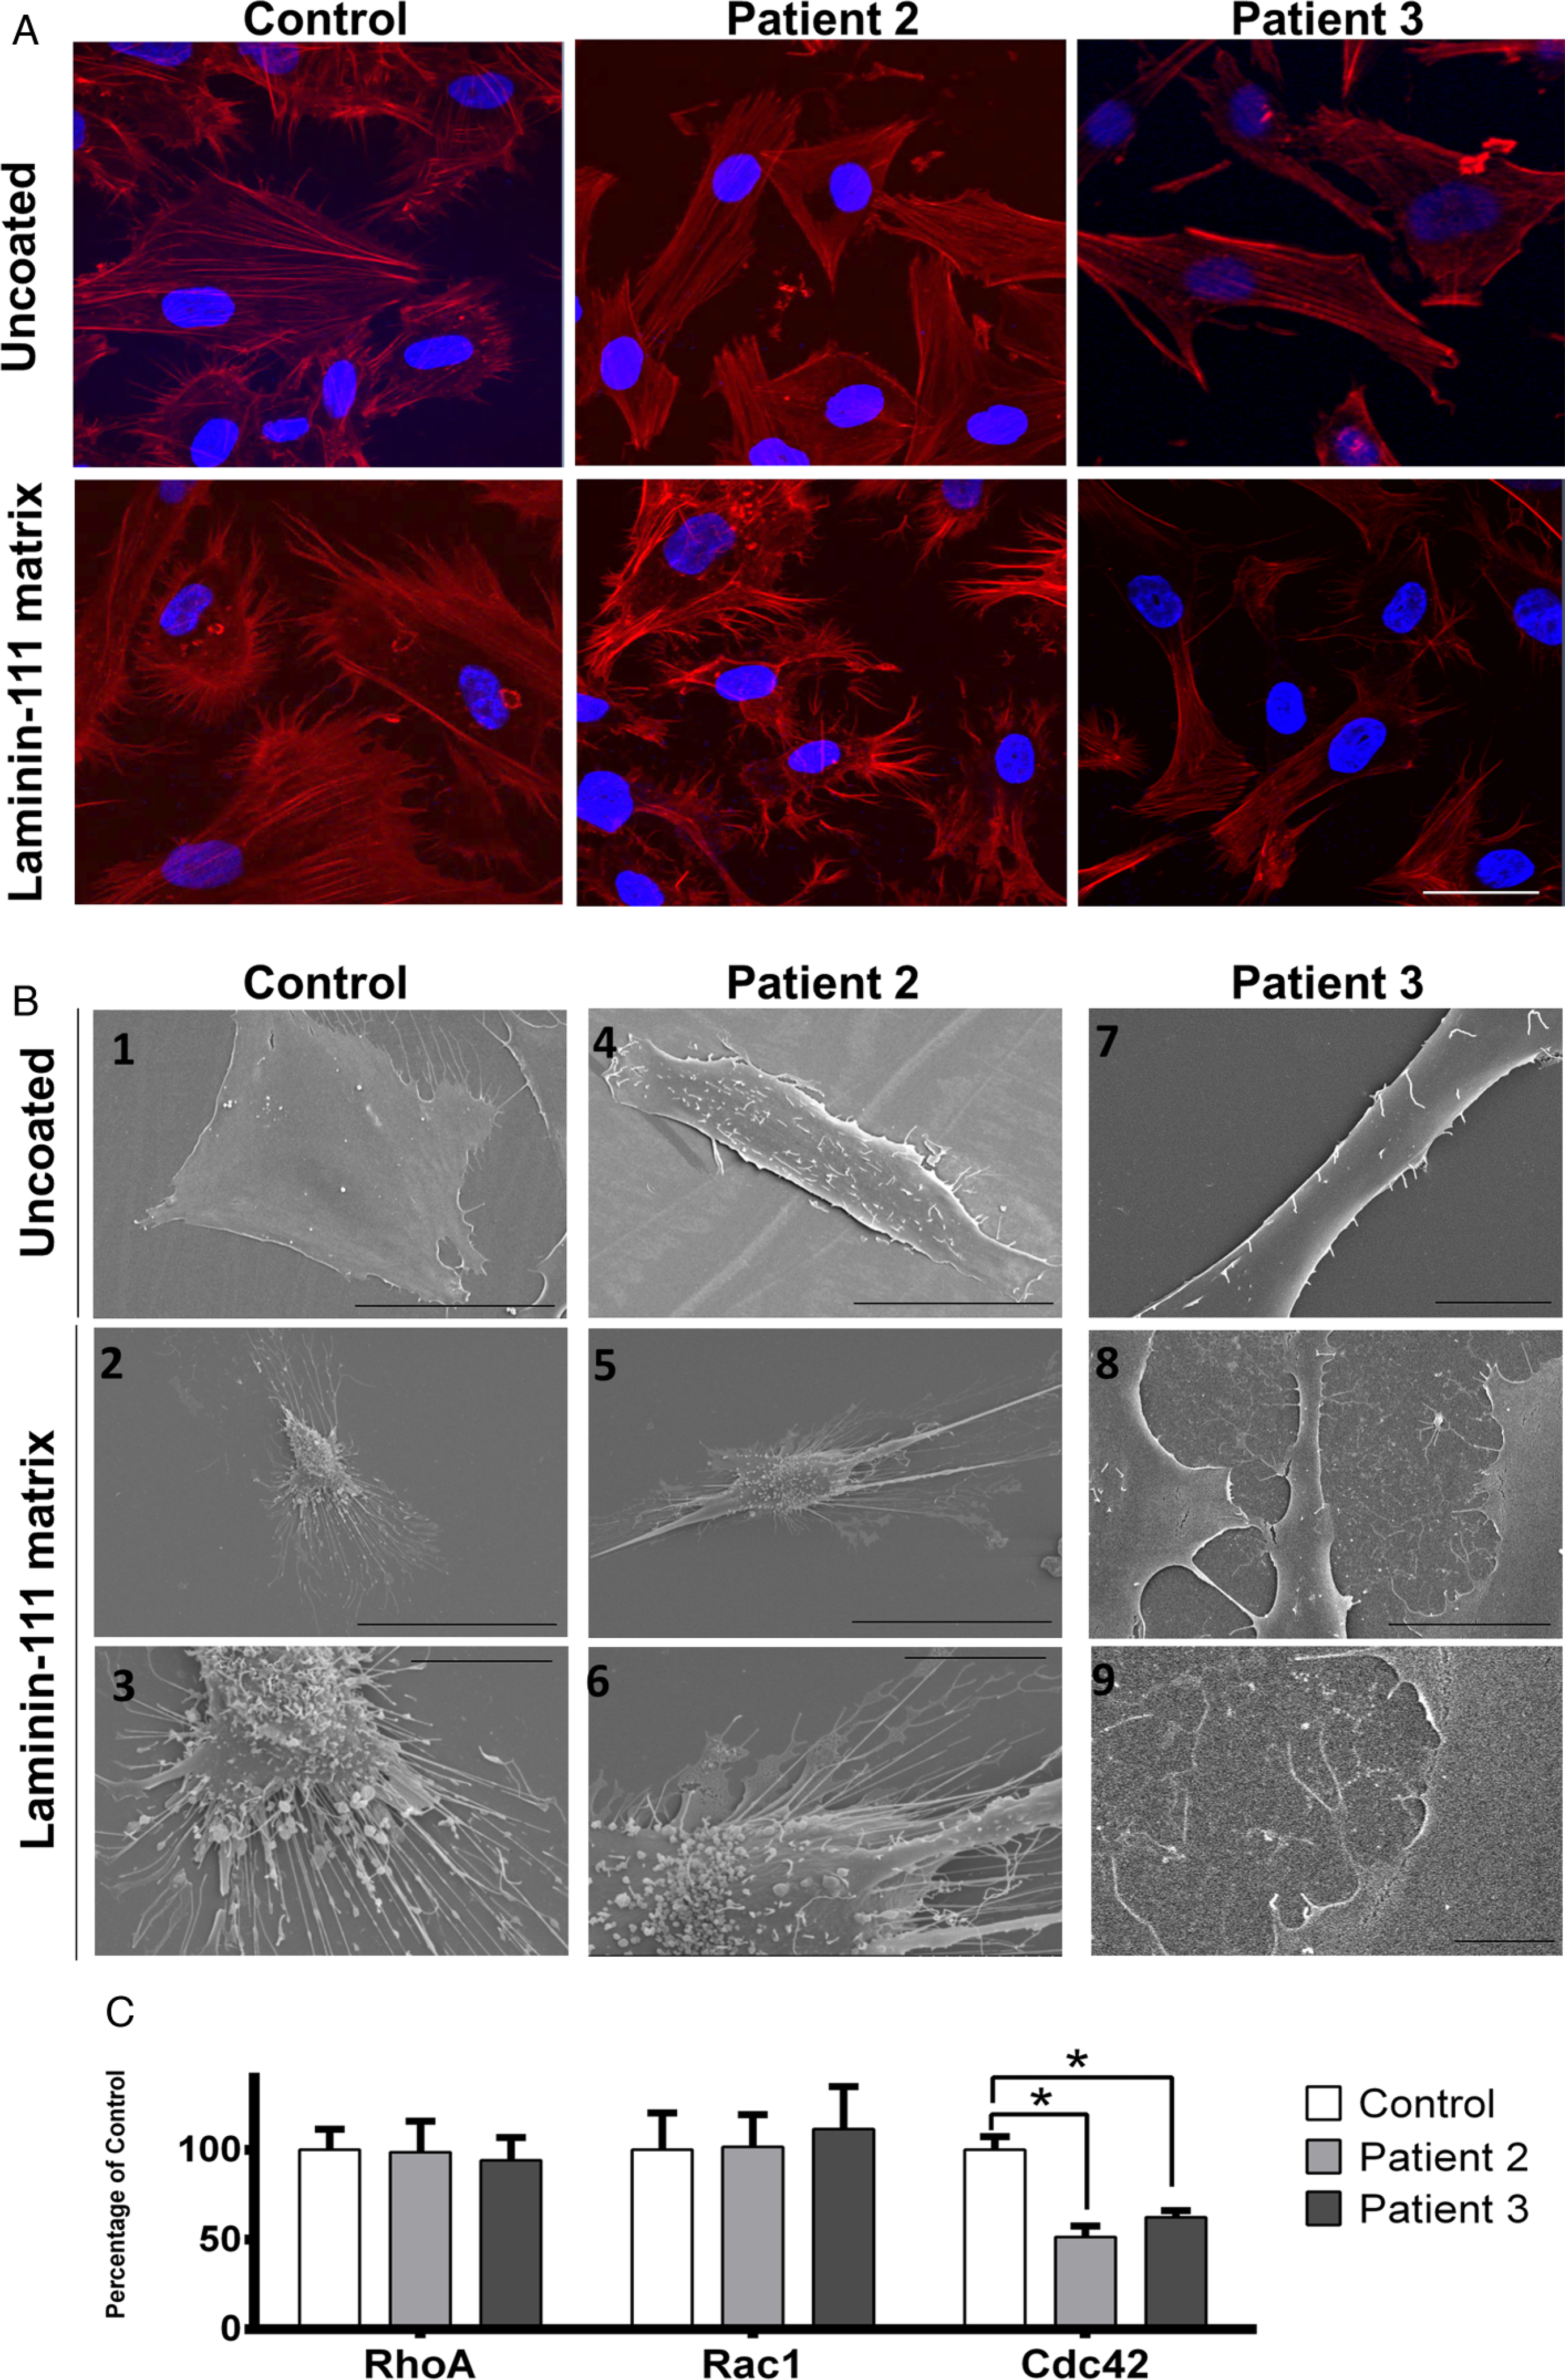
LAMA1 deficiency disrupts cell architecture for focal adhesion in fibroblasts. Equal numbers of cells from control and patient 2 fibroblasts were plated on non-coated or laminin-111-coated coverslips. Laminin-111 is a heterotrimer complex composed of LAMA1, LAMB1 and LAMC1. (A) Cells were imaged after staining with phalloidin (red) that labels actin filaments, and DAPI (blue) that labels the nuclei. On uncoated coverslips, the control cells show intact, highly organised cytoskeletal organisation, and numerous filopodia. In cells of patient 2 and patient 3, there is less complexity in cytoskeletal network, and filopodia structures are remarkably reduced or absent, indicating the importance of LAMA1 in the focal adhesion complex. On laminin-111-coated coverslips, control cells appear to spread more than on non-coated coverslips, while the filopodia length is increased. Cells of patient 2 and patient 3 show increased number of filopodia on laminin-coated coverslips. Scale bar represents 20 μm. (B) On scanning electron microscopy, control cells on uncoated slides appear thoroughly spread and flat with well-formed filopodia structures at the edges, as expected in normal control fibroblasts.45 Patient 2 and patient 3 cells on uncoated slides generally appear ‘lifted’, creating a three-dimensional appearance. The number of filopodia in patient 2 cells are markedly lower as compared with control cells; this number normalised to almost similar to control cells when patient 2 and patient 3 cells were grown on laminin-coated slides. In addition, microvilli protrusions, which are presumably unattached filopodia or lamellipodia, are seen on the surface of the cells. Scale bars in (B) represent 50 μm in B1–2 and B4–5, 10 μm in B3, B6, B7 and B9 and 25 μm in B8. (C) GTPase activation assay of Cdc42, Rac1 and RhoA was performed in control and patient 2 fibroblasts. Results show a significant decrease of the activated form (GTP-bound) of Cdc42 in patient 2 and patient 3 fibroblasts compared with control; no difference was observed for Rac1 and RhoA (error bars represent SD, n=6; *p<0.05, Mann–Whitney test).