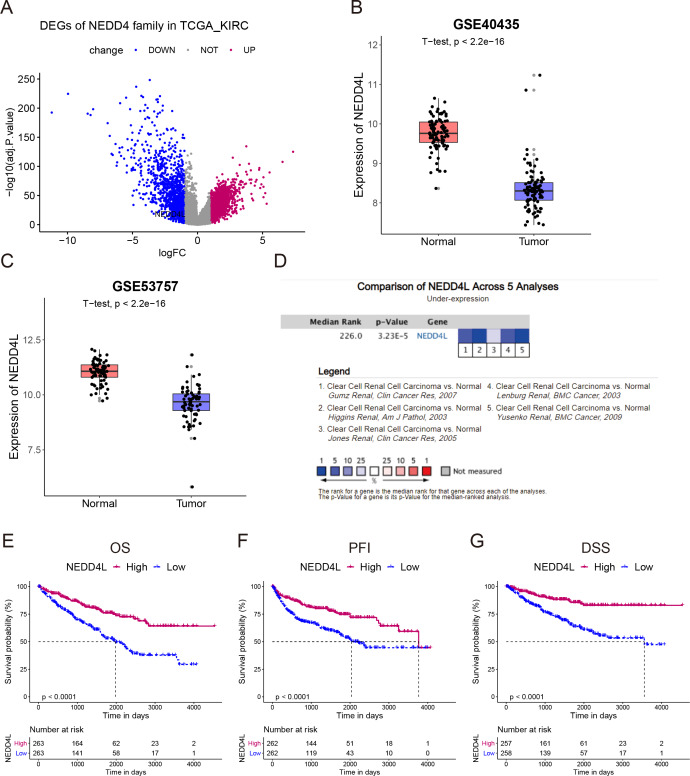
Figure 1. Expression and prognostic analysis of NEDD4L in ccRCC.
(A) In TCGA_KIRC data set, DEGs were represented in a volcano plot. (B & C) Mining of the GEO database showed that NEDD4L was downregulated in tumor tissues. (D) Data from the Oncomine database confirmed that NEDD4L was significantly downregulated in tumor tissues. (E) Kaplan–Meier curves of the OS of the patients with ccRCC. (F) Kaplan–Meier curves of the PFI of the patients with ccRCC. (G) Kaplan–Meier curves of the DSS of the patients with ccRCC.

