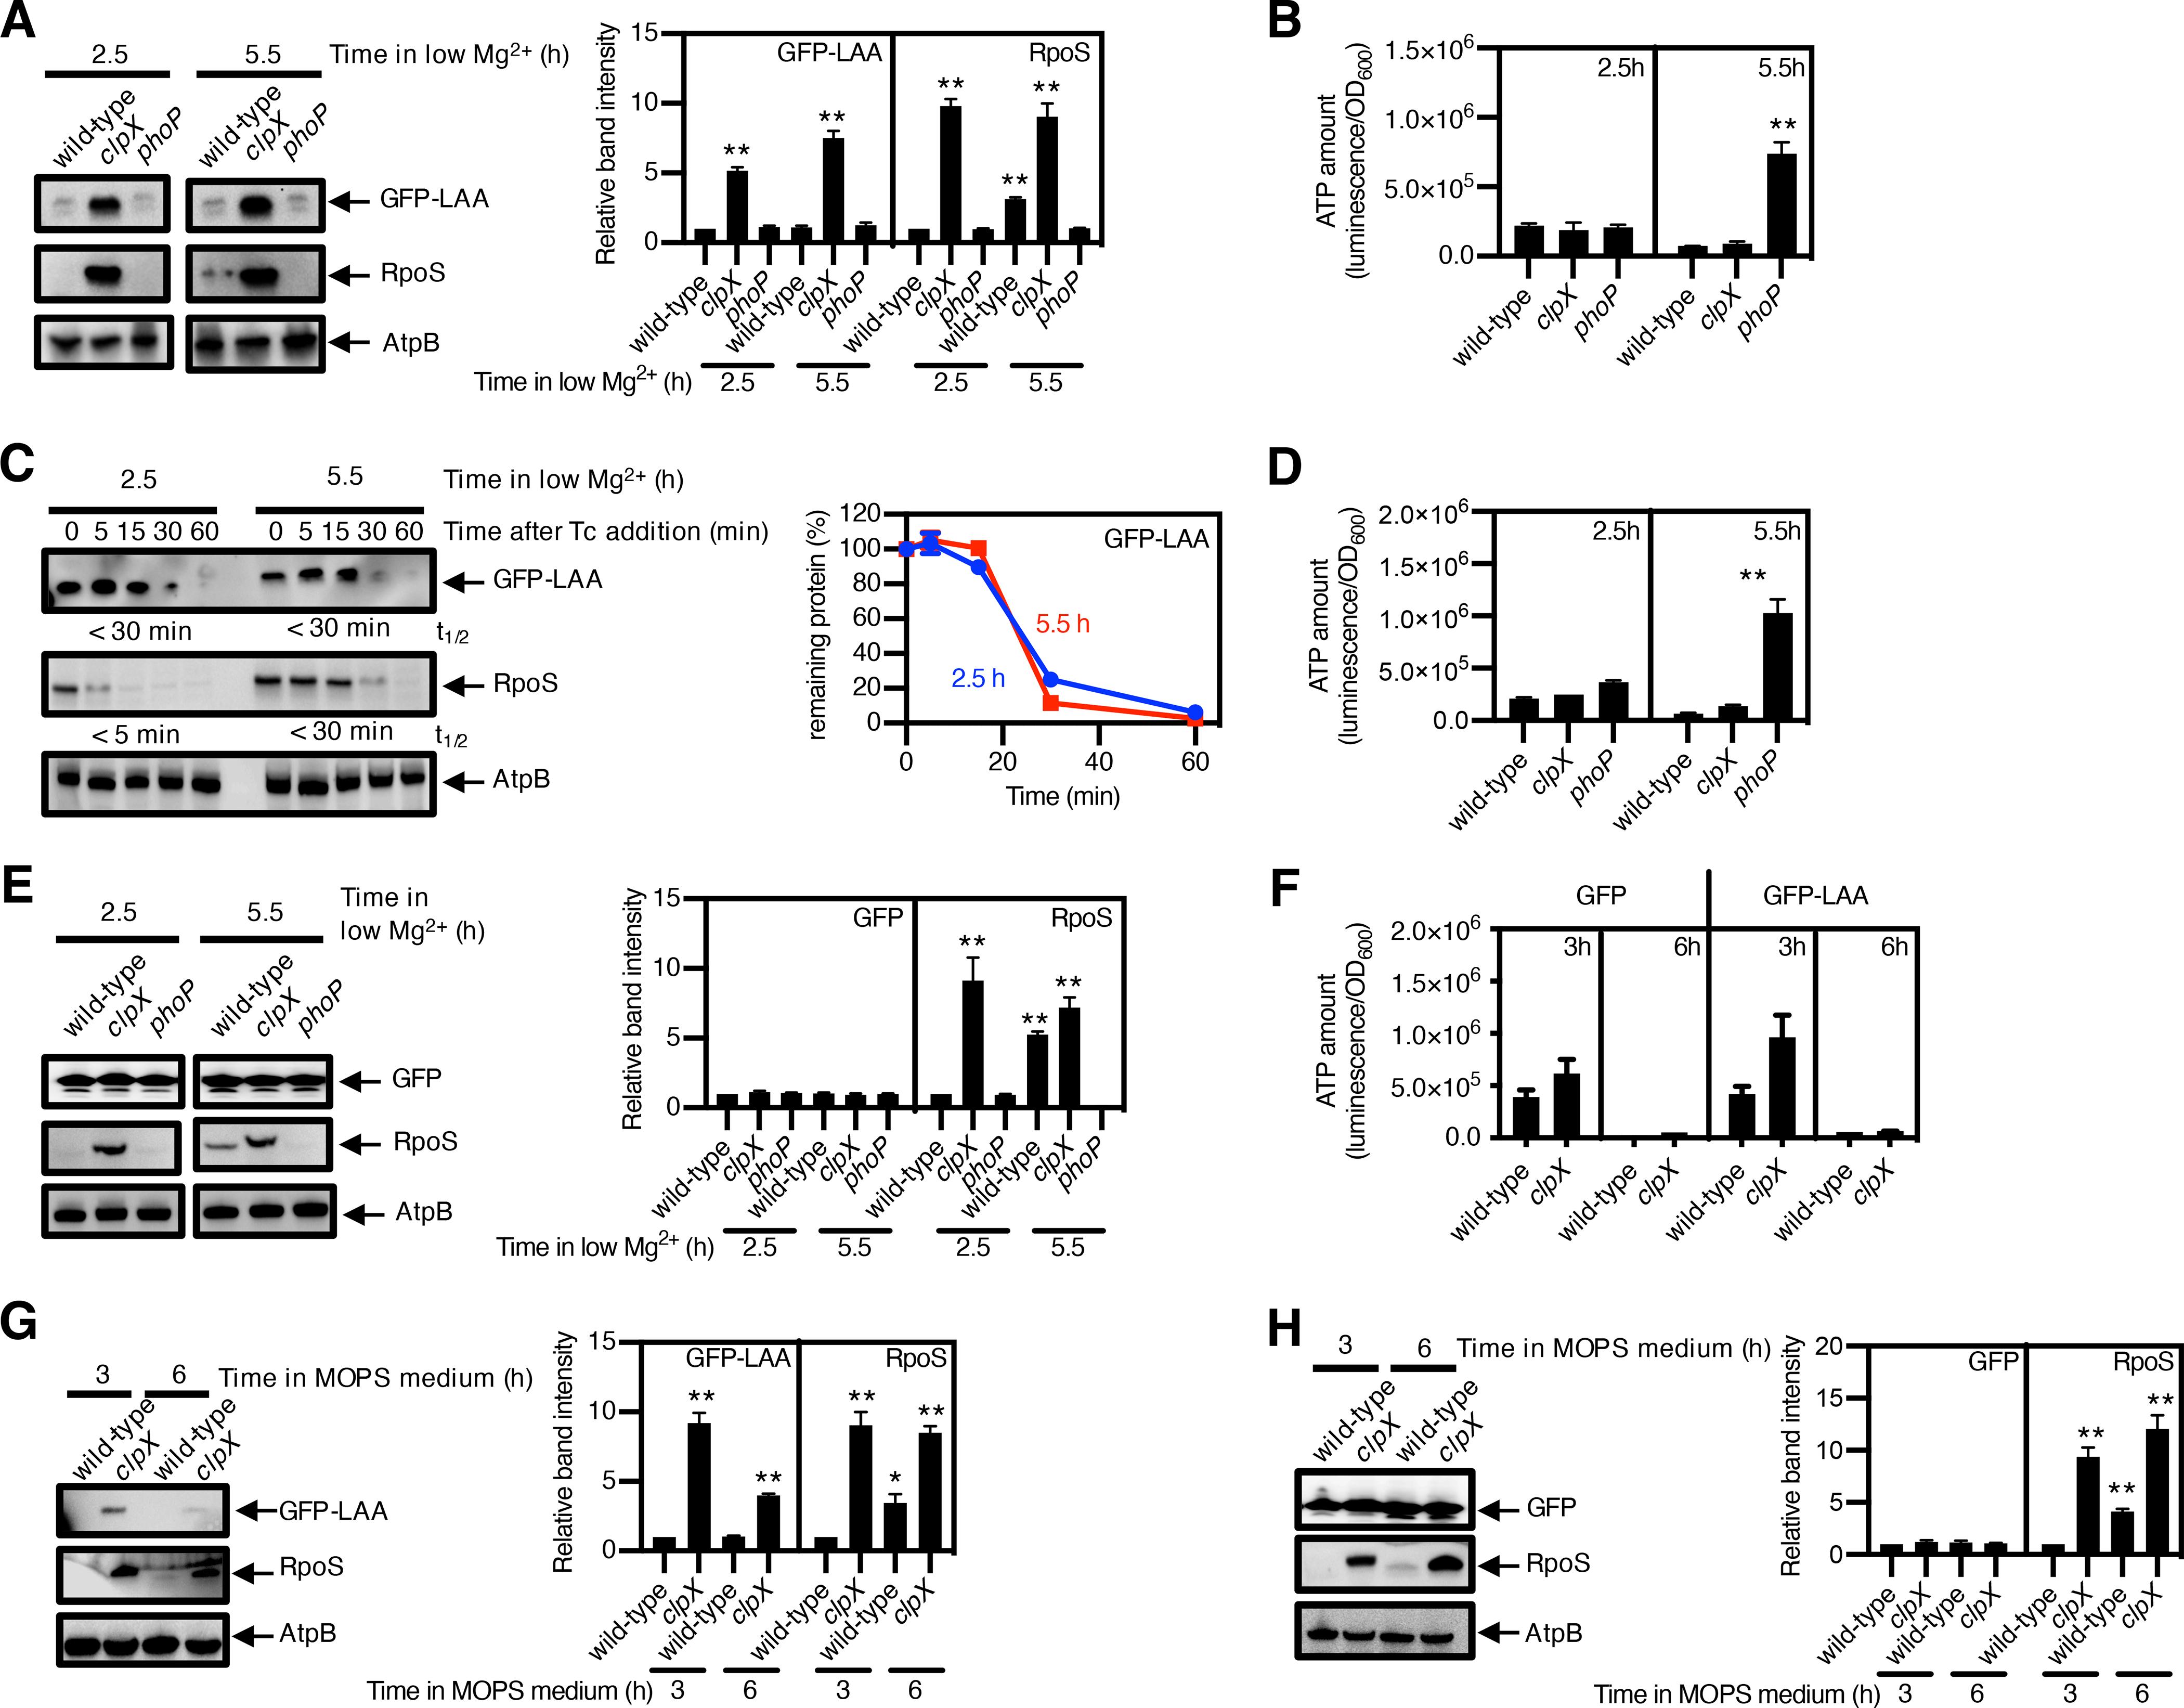
Fig. 3. Degradation of SsrA-tagged proteins continues unimpeded despite the reduction in ATP amounts during Mg2+ starvation.

(A) immunoblotting and quantification of the indicated protease substrates; (B) quantification of ATP amount; and (C) stability of the protease substrates in cysA-FLAG (JY767, wild-type), cysA-FLAG clpX (JY1043, clpX) and cysA-FLAG phoP (JY901, phoP) S. Typhimurium expressing GFP-LAA. grown under low-Mg2+ conditions for 2.5 or 5.5 h. AtpB is a loading control. (D) Quantification of ATP and (E) immunoblotting and quantification of the indicated protease substrates in strains JY767 (wild-type), JY1043 (clpX), and JY901 (phoP) expressing GFP (100) and were grown under low-Mg2+ conditions for 2.5 h or 5.5 h. (F) Quantification of ATP and (G and H) the indicated protease substrates in strains JY767 (wild-type) and JY1043 (clpX) expressing GFP-LAA (G) or GFP (H) grown in Mg2+-replete MOPS medium for 3 or 6 h.
ATP amounts (A, D, F) were calculated with normalization to luminescence by OD600 and represent the mean and SD from 3 independent experiments. Unpaired Student’s t tests were performed between wild-type and the mutant strains; ***P < 0.001, **P < 0.01.
Densitometry graphs (B, E, G, H) show the average and SD of protein amounts from 3 independent experiments. Graphs correspond to the amounts in different strains relative to that of the wild-type, which was normalized to 1.0. Unpaired Student’s t tests were performed between wild-type samples at 2.5 h with the other combinations; **P < 0.01. Degradation curve and half-lives (t1/2) of protease substrates (C) were determined by band intensity from Western blots with protein amounts normalized to AtpB. The mean and SD from three 3 independent experiments are shown.
