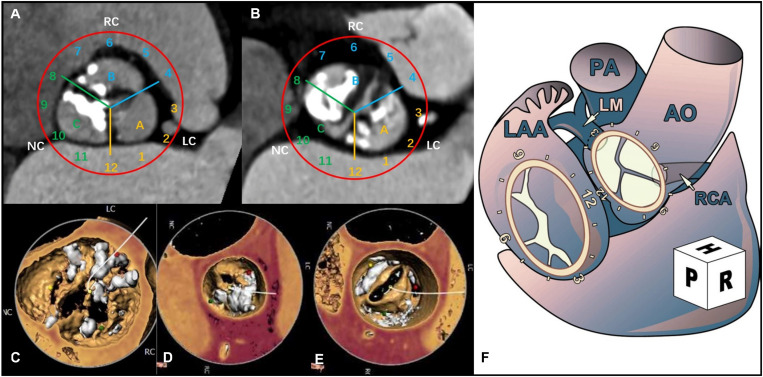
FIGURE 1.
Computerized tomography angiography (CTA) shows the distribution of aortic valve calcification using a surgeon’s view clock-face model. (A) The CTA cross section shows the distribution of the tricuspid aortic valve (TAV) calcification. (B) The CTA cross section shows the distribution of the bicuspid aortic valve (BAV) calcification. (C) 3-Dimensional (3D) view of the CTA image shows the eccentric calcification of the aortic valve in region A. (D) 3D view of the CTA image shows eccentric calcification in region B. (E) 3D view of the CTA image shows eccentric calcification in region C. (F) Surgical view of the left atrium (Ruiz et al., 2011).

