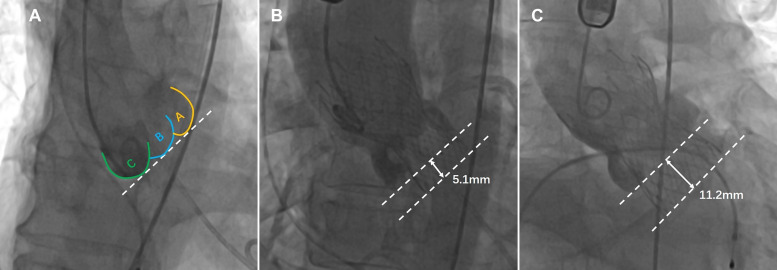
FIGURE 2.
The implantation depth of the Venus-A prosthesis was measured postoperatively from fluoroscopic images (the dashed lines represent the annular plane and the Venus-A valve base plane, respectively). (A) Distribution of three calcified regions on fluoroscopic images; (B) standard implantation depth; and (C) implantation position that is too deep.

