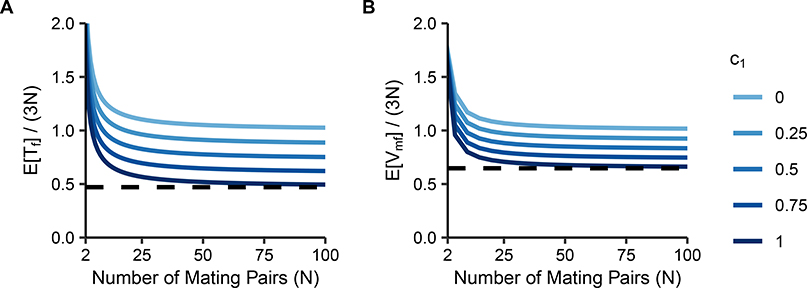
Figure 6:
Normalized mean coalescence times on the X chromosome under matrilateral-parallel first-cousin mating. Coalescence times are plotted as a function of the number of mating pairs (N) and the proportion of mating pairs that are matrilateral-parallel pairs (c1). (A) , Eq. 34. (B) , Eq. 37. The dashed lines represent the maximal reduction due to consanguinity, obtained by setting c1 = 1: in (A) and in (B).

