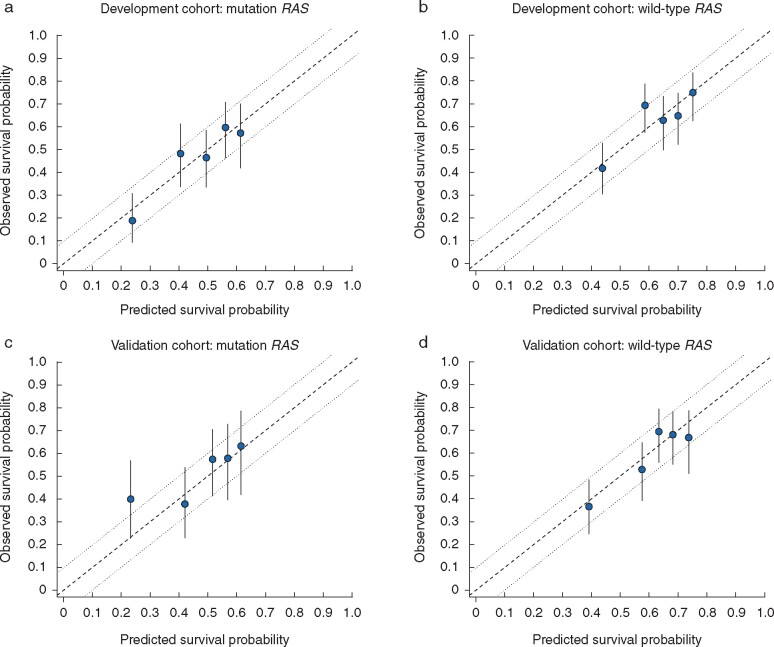
Fig. 2.
Calibration of prognostic model by mutant and wild-type RAS disease in development and external multi-international validation cohorts
Calibration plots for a mutant and b wild-type RAS disease in development cohort, and c mutant and d wild-type RAS disease in validation cohort. Observed overall survival probability was measured by Kaplan–Meier analysis; error bars represent 95 per cent c.i. The dashed line represents the ideal reference line where observed survival corresponds with predicted survival, and the dotted lines indicate the 10 per cent margin of error.

