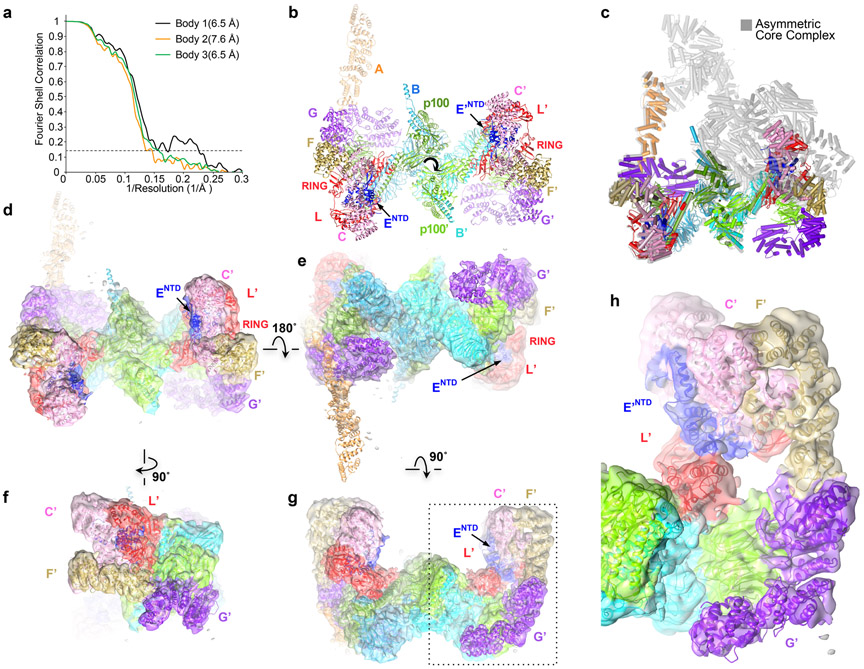
Extended Data Fig. 7. An inactive, 2-fold symmetric Core complex corresponding to ~1% of the data set.
a, Graph shows gold-standard FSC plots between two independently refined half-maps for the three focused bodies of the RELION3 multi-body reconstruction in point group C1 with 7,331 particles. The resolution of the three bodies at the FSC value of 0.143 is 6.4, 6.5 and 7.6 Å, with the third body corresponding to what is the active side in the canonical Core complex.
b, Model of the proper 2-fold symmetric Core, built by fitting individual subunits or their domains into the density with CHIMERA47. There is residual FANCA density only for its NTD, although it is very weak on the side (right side) that has overall weaker density. It is possible that the stronger FANCANTD density on the left side is due to 3D classification not removing all asymmetric Core particles. View is looking down the 2-fold axis (marked by curved arrow) as in Figure 1a.
c, Superposition of the 2-fold symmetric (colored as in b) and asymmetric (gray) Core complexes by aligning the central portion of the FANCB-FAAP100 hub.
d-f, Cryo-EM density of the proper 2-fold symmetric Core complex in four orientations related by operations shown. The partially transparent maps are colored by subunit, and the model is overlaid. d is the same orientation as b. FANCC’-FANCE’-FANCF’-FANCG’-FANCL’ are labeled. The bashed box is the area shown in a close-up in g.
g, Close-up view of f focusing on the second FANCL’ sequestered by FANCC’-FANCE’-FANCF’.

