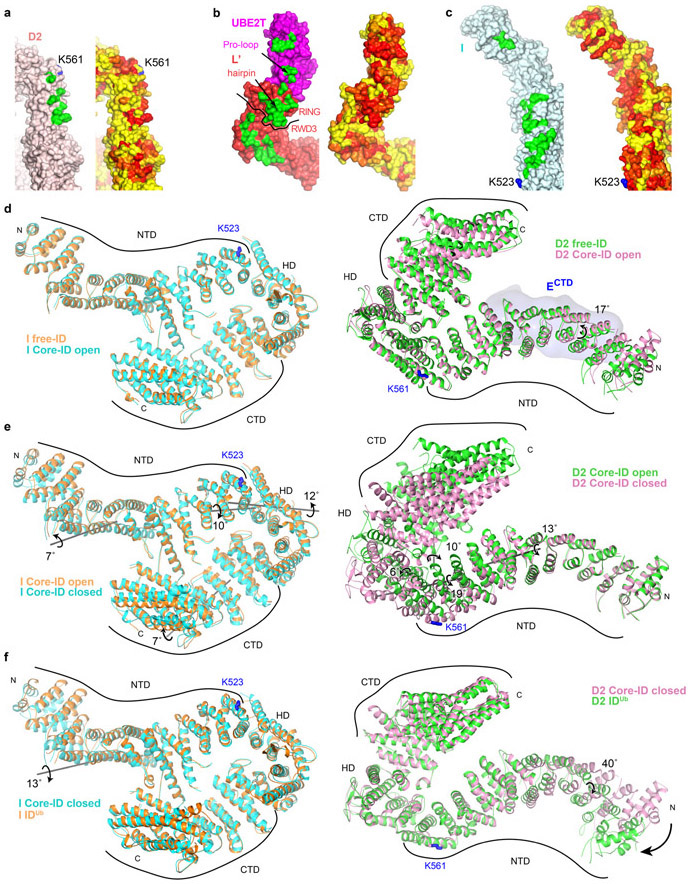
Extended Data Fig. 9. FANCI and FANCD2 conservation and conformational changes.
a-c, Molecular surface representations of FANCD2 (a), FANCL’-UBE2T (b) and FANCI (c) viewed from the perspective of the interacting partner (FANCL’-UBE2T perspective for FANCI and FANCD2, and ID perspective for FANCL’-UBE2T). For each, left surface has the intermolecular contacts marked in green (FANCL’UBE2T contacts for FANCI and FANCD2, and ID contacts for FANCL’-UBE2T), and right surface is colored by conservation (yellow to red for low to high conservation). Select elements of FANCL’UBE2T are labeled. Dark curve on FANCL’ delineates its RWD3 and RING domains.
d, The FANCI (left, cyan) and FANCD2 (right, pink) proteins from the open conformation Core-ID complex superimposed on the corresponding proteins from the free human ID complex28 (orange FANCI and green FANCD2). FANCECTD is shown as a light blue surface. Additional discussion in Supplementary Note 6.
e, Closed conformation FANCI (left, cyan) and FANCD2 (right, pink) proteins superimposed on those of the open-conformation complex (orange FANCI and green FANCD2). Additional discussion in Supplementary Note 6.
f, Closed conformation FANCI (left, cyan) and FANCD2 (right, pink) superimposed on the IDUb proteins28 (orange FANCI and green FANCD2). Rotation axis and directions are marked by grey lines and curved arrows. Rotation angles, mono-ubiquitination sites, and the N- and C-termini of FANCI and FANCD2 are labeled.

