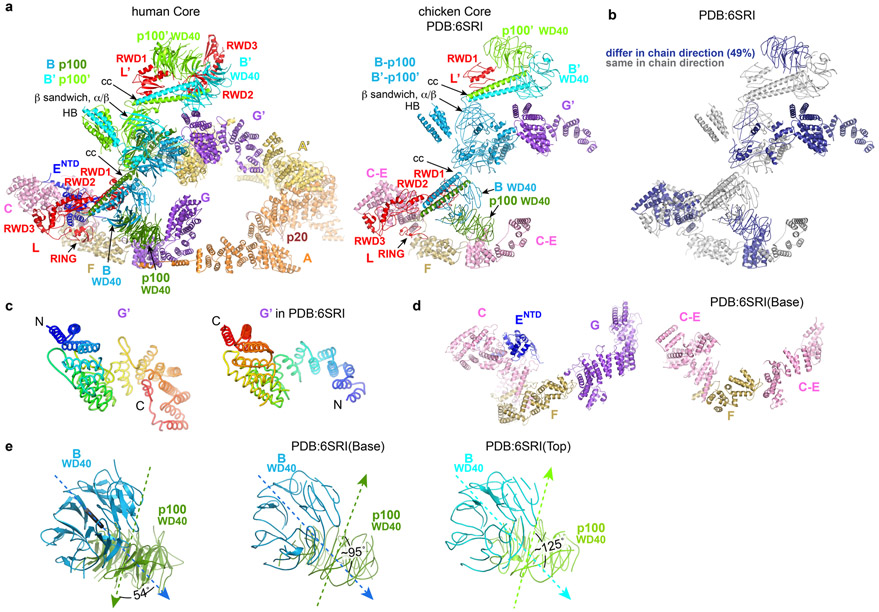
Extended Data Fig. 10. Comparison of the human and chicken Core complexes.
a, Side by side comparison of the human apo-Core complex reported in this paper (left) and the chicken Core complex reported by Shakeel et al22 (right, PDB:6SRI), oriented approximately as Figure 1e of the Shakeel et al paper. Subunits of the chicken Core are labeled according to the proposed interpretation in the PDB file and figures of the Shakeel et al study. Because FANCB and FAAP100’ (except their WD40 and coiled-coil domains) could not be distinguished in that study, they are both colored blue and labeled as “B-P100 and B’-P100’ ”. Similarly, FANCC, FANCE and the N-terminal portion of FANCF were not distinguished; they are all colored pink and labeled “C-E”. The FANCF C-terminal portion, for which a crystal structure exists31, is labeled as “F”. The rest of the subunits are colored and labeled as in Figure 1a here.
b, Cartoon shows the chicken Core colored gray for polypeptide chains traced in the same direction as the human complex, and dark blue for those traced in the opposite direction (49 % of residues).
c, The FANCG’ polypeptide chains in the human (left) and chicken (right) Core complexes have opposite directions. FANCG’ proteins are represented as tubes colored from blue (N-terminus) to red (C terminus).
d, Side-by-side comparison of the portion referred to as “base region” in the Shakeel et al study (human Core left, chicken Core right) labeled and colored as in a.
e, Comparison of FANCB-FAAP100 WD40-WD40 domains of the human (1st panel) and chicken (2nd and 3rd panels) core complexes. The dotted arrows indicate the self-rotation axis of the β-propellers, with the arrowheads indicating their orientations. The angles between the two axes are marked. Additional discussion in Supplementary Note 7.

