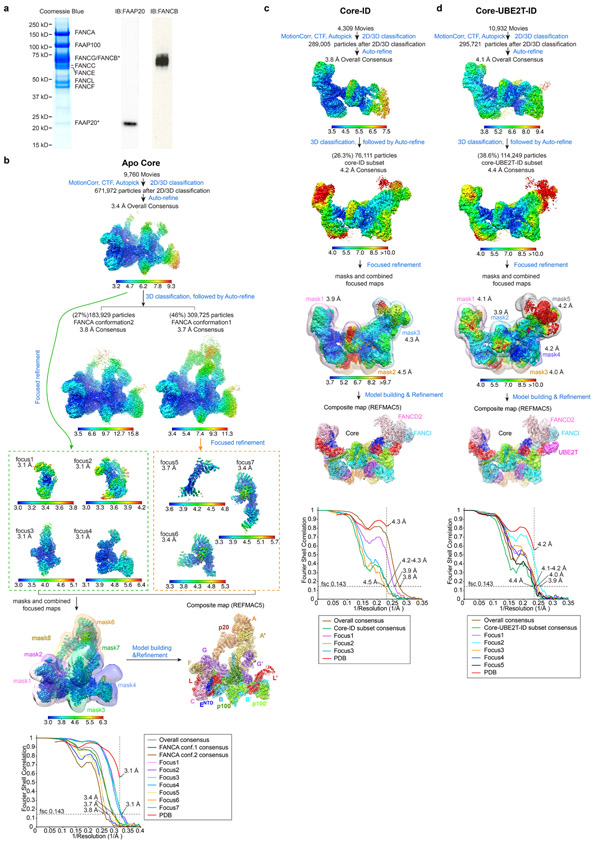
Extended Data Fig. 1. Cryo-EM reconstruction of the FA Core, Core-ID and Core-UBE2T-ID complexes.
a, Left, coomassie stained gel of the purified Core Complex containing recombinant subunits FANCA, FANCB, FANCC, FANCE, FANCF, FANCG, FANCL and FAAP100 and endogenous FAAP20 as labeled. Right, immunoblots confirming the identity of the FAAP20 and also showing the presence of FANCB, which overlaps with FANCG in the coomassie-stained gel.
b-d, Flowcharts of single particle cryo-EM data processing of the Core complex (b), Core-ID complex (c) and Core-UBE2T-ID complex (d). Consensus and focused reconstructions are colored by local resolution (RELION3) as indicated with the color keys (“>” marks a low resolution cutoff of ~10 Å). Orientation is similar to Figure 1a. In b, all seven focused reconstructions are shown individually in orientations that match the consensus map (inside two dashed rectangles). They are also shown in a combined style with their corresponding masks used for focused refinements shown as semi-transparent in different colors (below the green dashed rectangle). The composite map (below the orange dashed rectangle) is shown in semi-transparent rendering and colored by subunit. In c and d, all focused reconstructions are combined in a single figure, with their corresponding masks shown as semi-transparent surfaces in different colors. Overall resolutions for each focused map are also indicated. The composite maps are shown in semi-transparent rendering and colored by subunit. Graphs at the bottom show gold-standard FSC plots between two independently refined half-maps for the consensus and focused reconstructions with the FSC cutoff 0.143 marked by horizontal dashed lines. The FSC plot of the refined models (labeled PDB) versus the composite cryo-EM map is shown in red, with the FSC cutoff marked by vertical dashed lines. The compositions of the masks are described in Supplementary Note 1.

