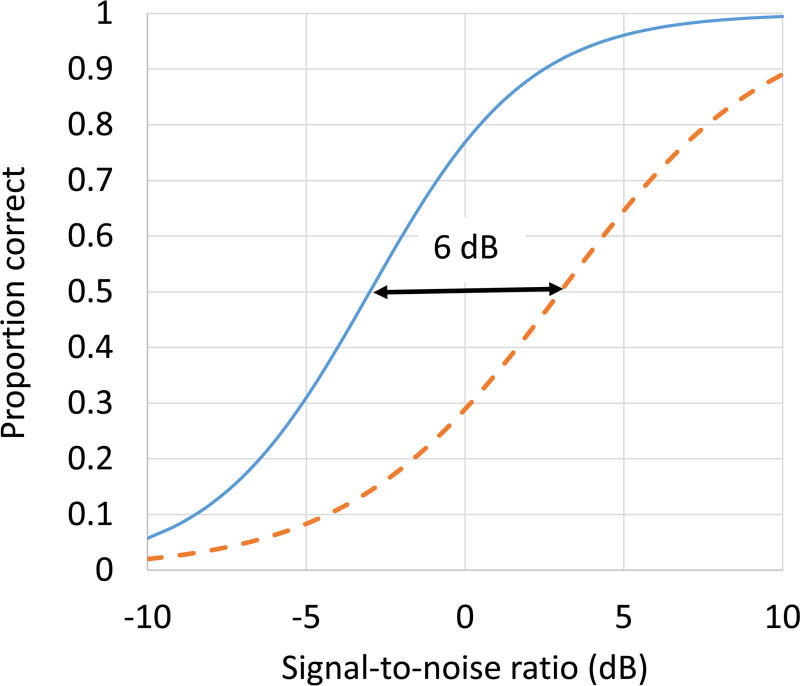
Fig. 3.
For the top-level test shown in Figure 2 (e.g., perception of meaningful sentences in noise and reverberation), the solid line shows a hypothetical age-appropriate psychometric function, and the dashed line shows the psychometric function for an individual child with a deficit on this task. The arrow shows the magnitude of the deficit, 6 dB, when measured at 50% of items correct.

