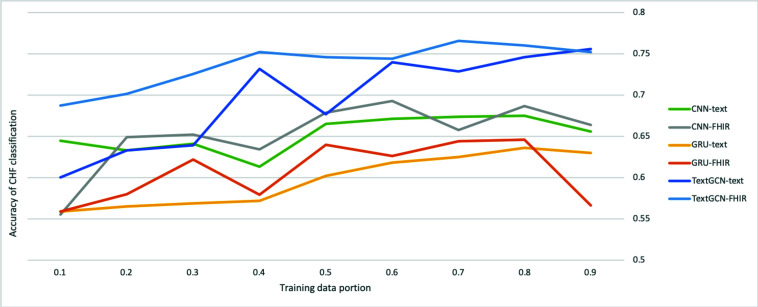
Figure 4.
The impact of proportions of data into training on one of the comorbidity classifications (Congestive Heart Failure, CHF). The x-axis is the ratio of training data used from the all labeled data (training + testing), and the y-axis is the accuracy of CHF as an example of the comorbidities.

