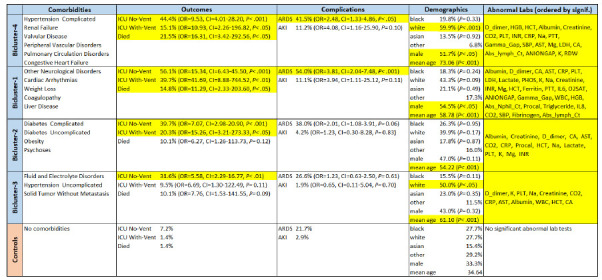
Table 1.
Subgroup-level analysis showing for each of the four biclusters, their outcomes, complications, demographics, and abnormal laboratory tests (only significant laboratory test results after multiple testing correction are shown; OR and CI values are not shown due to space constraints). Cells highlighted in yellow are significant compared to the control group after multiple testing correction.

|
|---|
