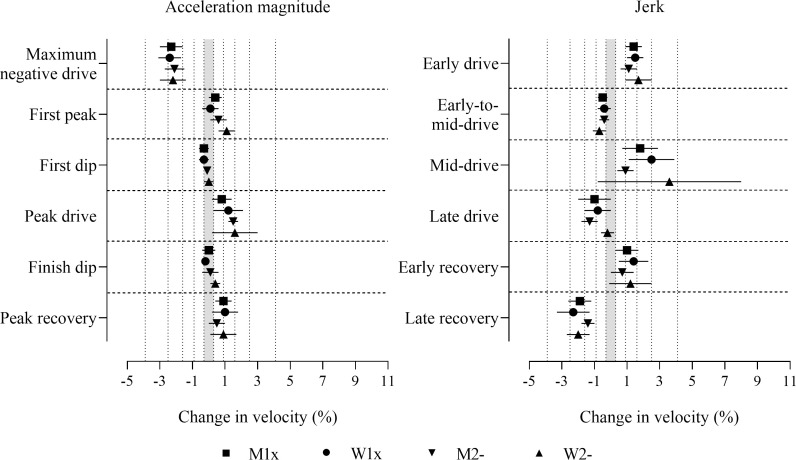
Fig 3. Change in boat velocity for a change in each predictor variable of two within-crew standard deviations without adjustment for stroke rate or power output.
Data are mean (%) and 90% compatibility intervals. The shaded grey area covers trivial values (values within the smallest substantial change thresholds, -0.3 to 0.3%). Vertical dotted lines delineate threshold magnitudes of small (±0.3), moderate (±0.9), large (±1.6), very large (±2.5), and extremely large (4.1, -3.9%). Effects with compatibility intervals that do not enter the grey area are decisively (very likely or most likely) substantial. Effects with compatibility intervals that end within the grey area have adequate precision (possibly or likely substantial or trivial).

