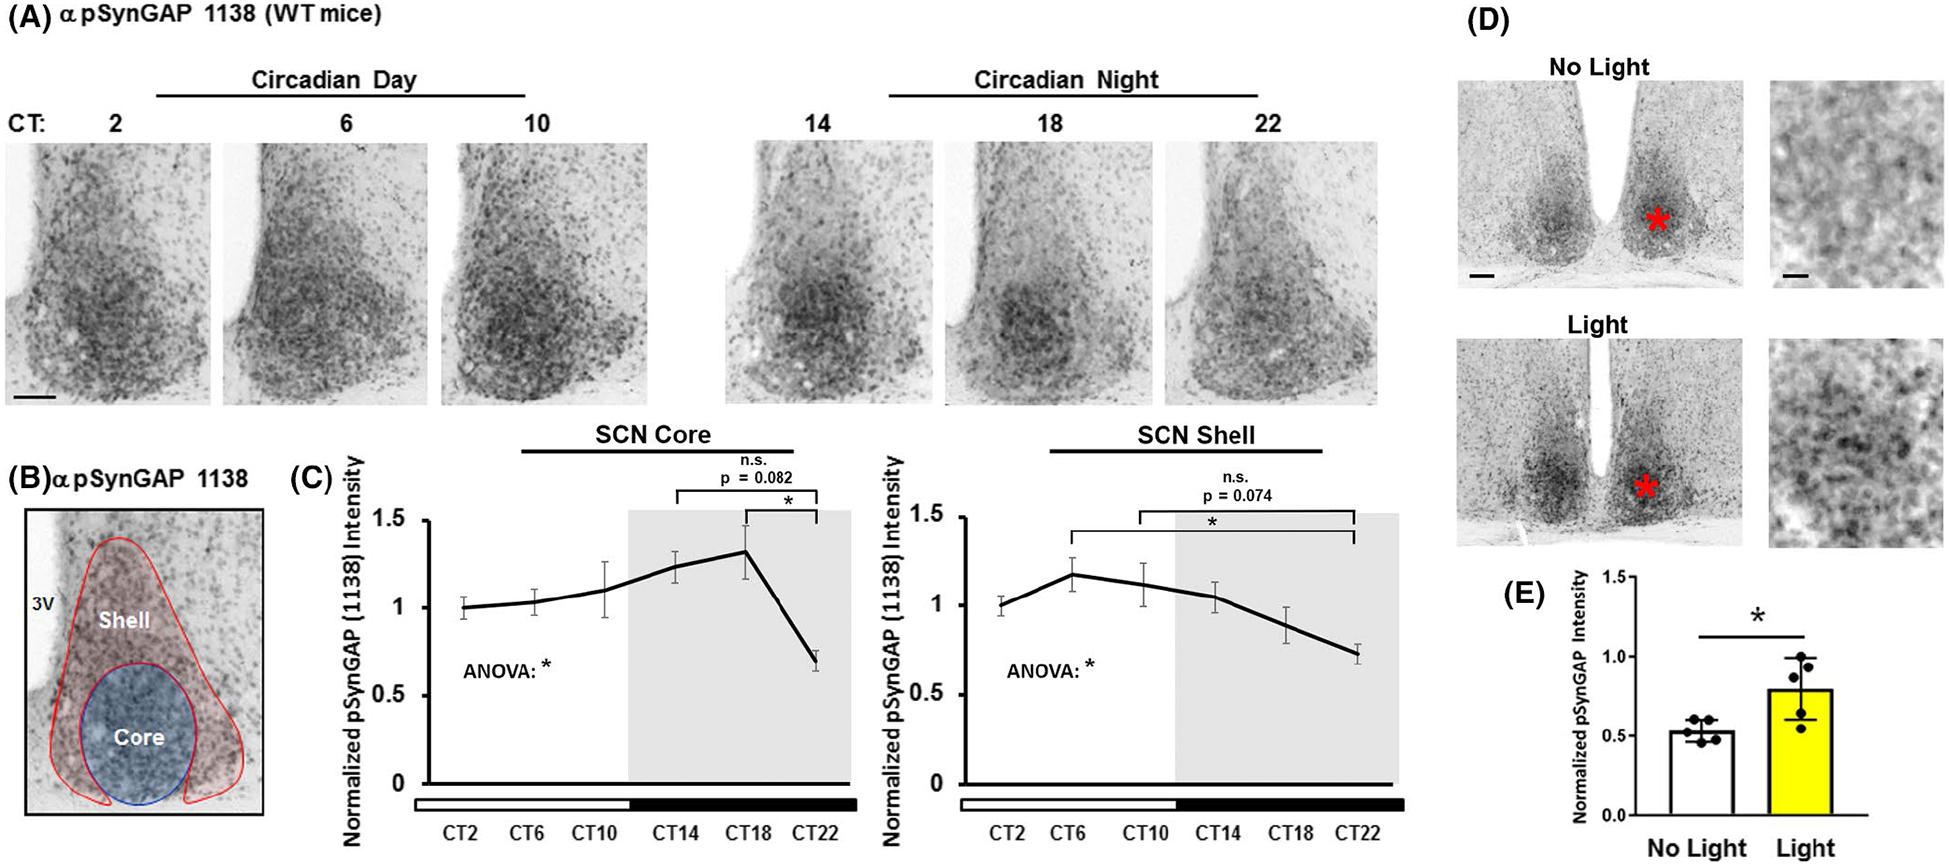
FIGURE 3.

SynGAP phosphorylation at serine 1138 (pSynGAP) in the SCN across the circadian day and after a nighttime light pulse. (A) Immunolabeling-based profiling of pSynGAP over the circadian cycle: tissue was collected at four hour intervals beginning at CT2. Scale bar = 100 μm. (B) As a reference, the neuroanatomical demarcation of the SCN shell (red) and core (blue) is denoted. (C) pSynGAP expression as a function of circadian time is profiled in the SCN core (left panel) and shell (right panel). Data were normalized to the CT2 mean intensity values, which were set equal to 1. N = 5–6 animals per timepoint; data were analyzed using one-way ANOVA followed by post-hoc tests. *: p < .05; n.s. = not significant. (D) Representative immunolabeling for pSynGAP after a 15 minute (~100 lux) light pulse (or no pulse) at CT15. Note that the asterisks in the low magnification images (left panels) approximate the locations of the magnified regions in the right panels. Scale bar = 200 μm for low magnification images and 100 μm for high magnification images. (E) Graphical representation of relative pSynGAP intensity under the two conditions. Data were normalized to the light-pulsed animal with the highest pSynGAP expression, which was set equal to 1. N = 5 animals per timepoint; data were analyzed using the Student’s t-test. *: p < .05.
