
FIGURE 6.
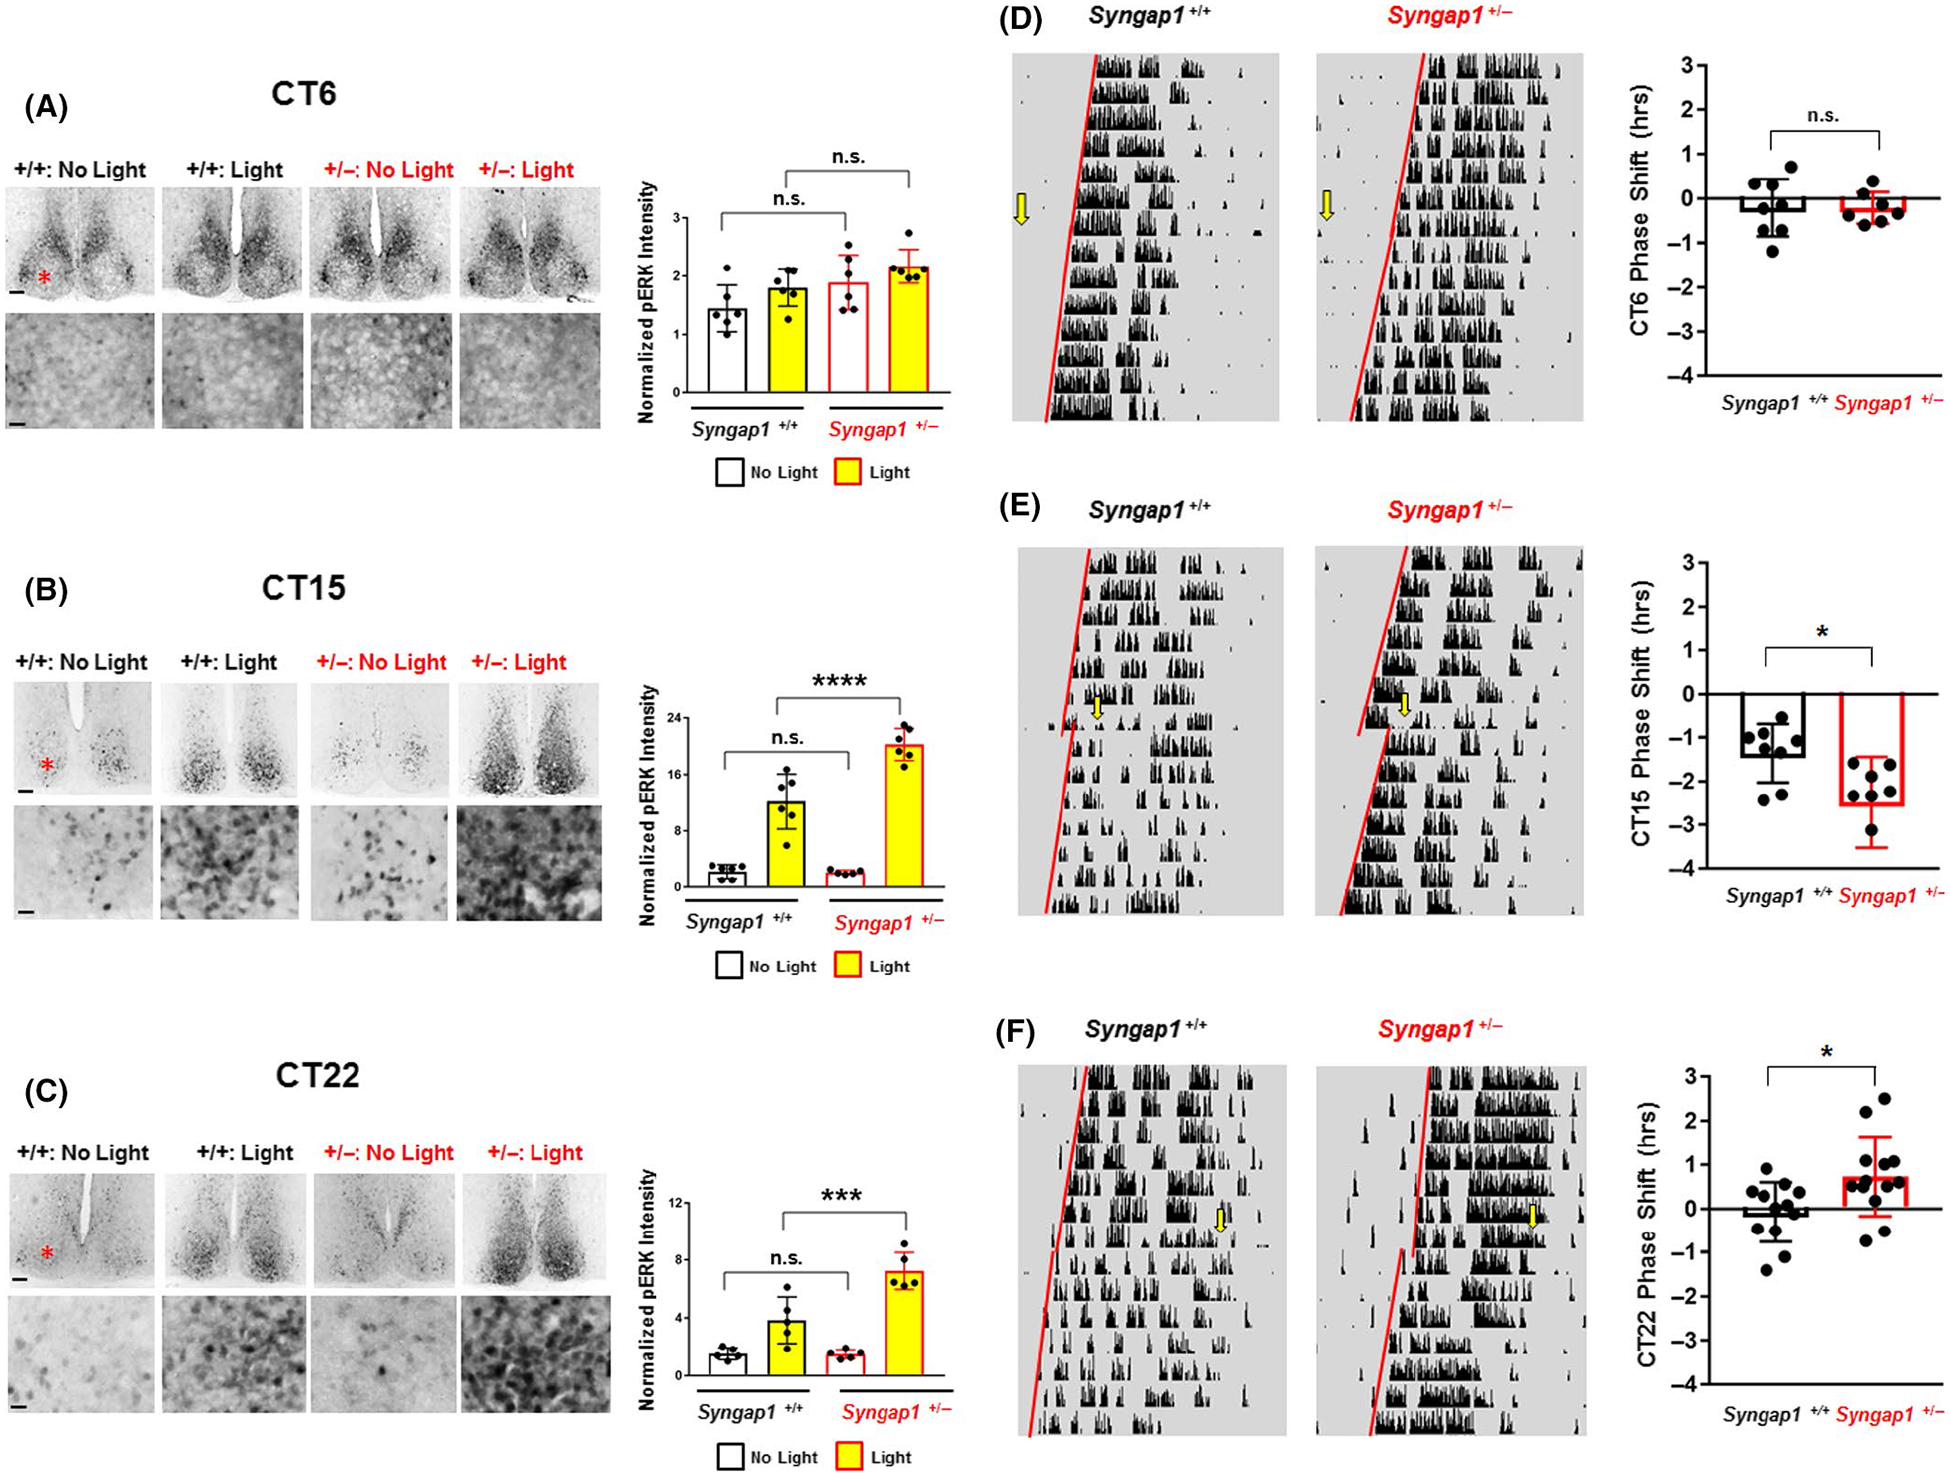
Syngap1 regulates light-evoked ERK/MAPK activation and clock entrainment. (A-C: left panels) Representative low (top panels) and high (bottom panels) magnification images of pERK immunostaining in Syngap1 +/+ and Syngap1 +/− mice exposed to light (15 min; ~40 lux) or not exposed to light during the subjective day (CT6) (A), early subjective night (CT 15) (B) and late subjective night (CT 22) (C). Note that the red asterisk in the top panel approximates the location of the region depicted in the bottom panel. Scale bar = 200 μm for low magnification images and 100 μm for high magnification images. (A–C: right panels) Quantitative analysis of pERK immunostaining. For each circadian time, data were normalized to the control (i.e., no light) Syngap1 +/+ animal with the lowest pERK intensity, and the pERK intensity/value of this animal was set equal to 1. (D–F: Left panels) Representative actograms from Syngap1 +/+ and Syngap1 +/− animals that were dark-adapted at least 2 weeks before being pulsed with light (15 min; ~40 lux) at CT 6 (D), CT 15 (E) and CT 22 (F). Yellow arrows denote the time of the light pulse, and red regression lines were drawn both before and after the pulse to approximate the phase-shift. (D–F: Right panels) Group mean ± SEM phase-shifting effects of light for each time point; the phase-shifting effects for each animal are presented in scatter plot form. N = 5–6 animals per genotype/condition for the pERK light pulse experiments and N = 7–13 animals per genotype/condition for the wheel-running light pulse experiments.*: p < .05; **: p < .01; ***: p < .001; ****: p < .0001; n.s. = not significant; pERK light pulse experiment data were analyzed by two-way ANOVA followed by post hoc tests, and wheel running pulse experiments were analyzed using Student’s t-test