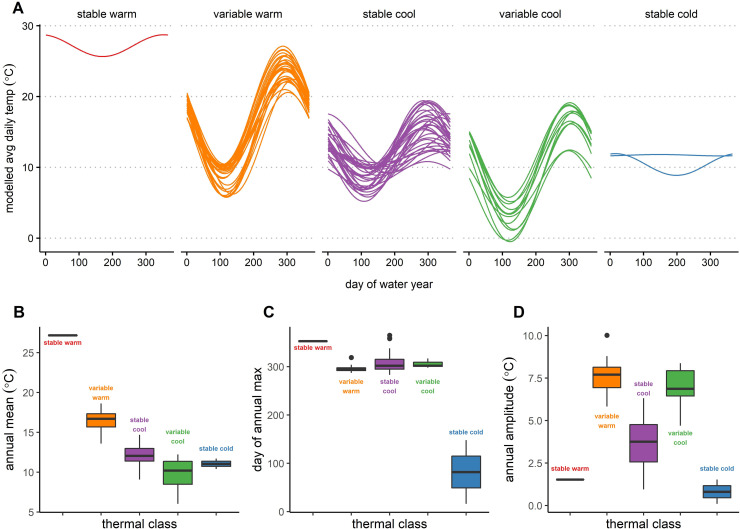
Fig 4. Thermal regime models and metrics.
a) Classified models and box plots of b) annual mean, c) day of annual maximum, and d) annual amplitude; based on Maheu et al. [31]: Fig 3, with permission. Thermal regimes were characterized based on their mean annual maximum (warm, cool, or cold) and relative annual variability. The number of members for each class (n) is as follows: Stable warm (n = 1), variable warm (n = 30), variable cool (n = 12), stable cool (n = 32), stable cold (n = 2).

