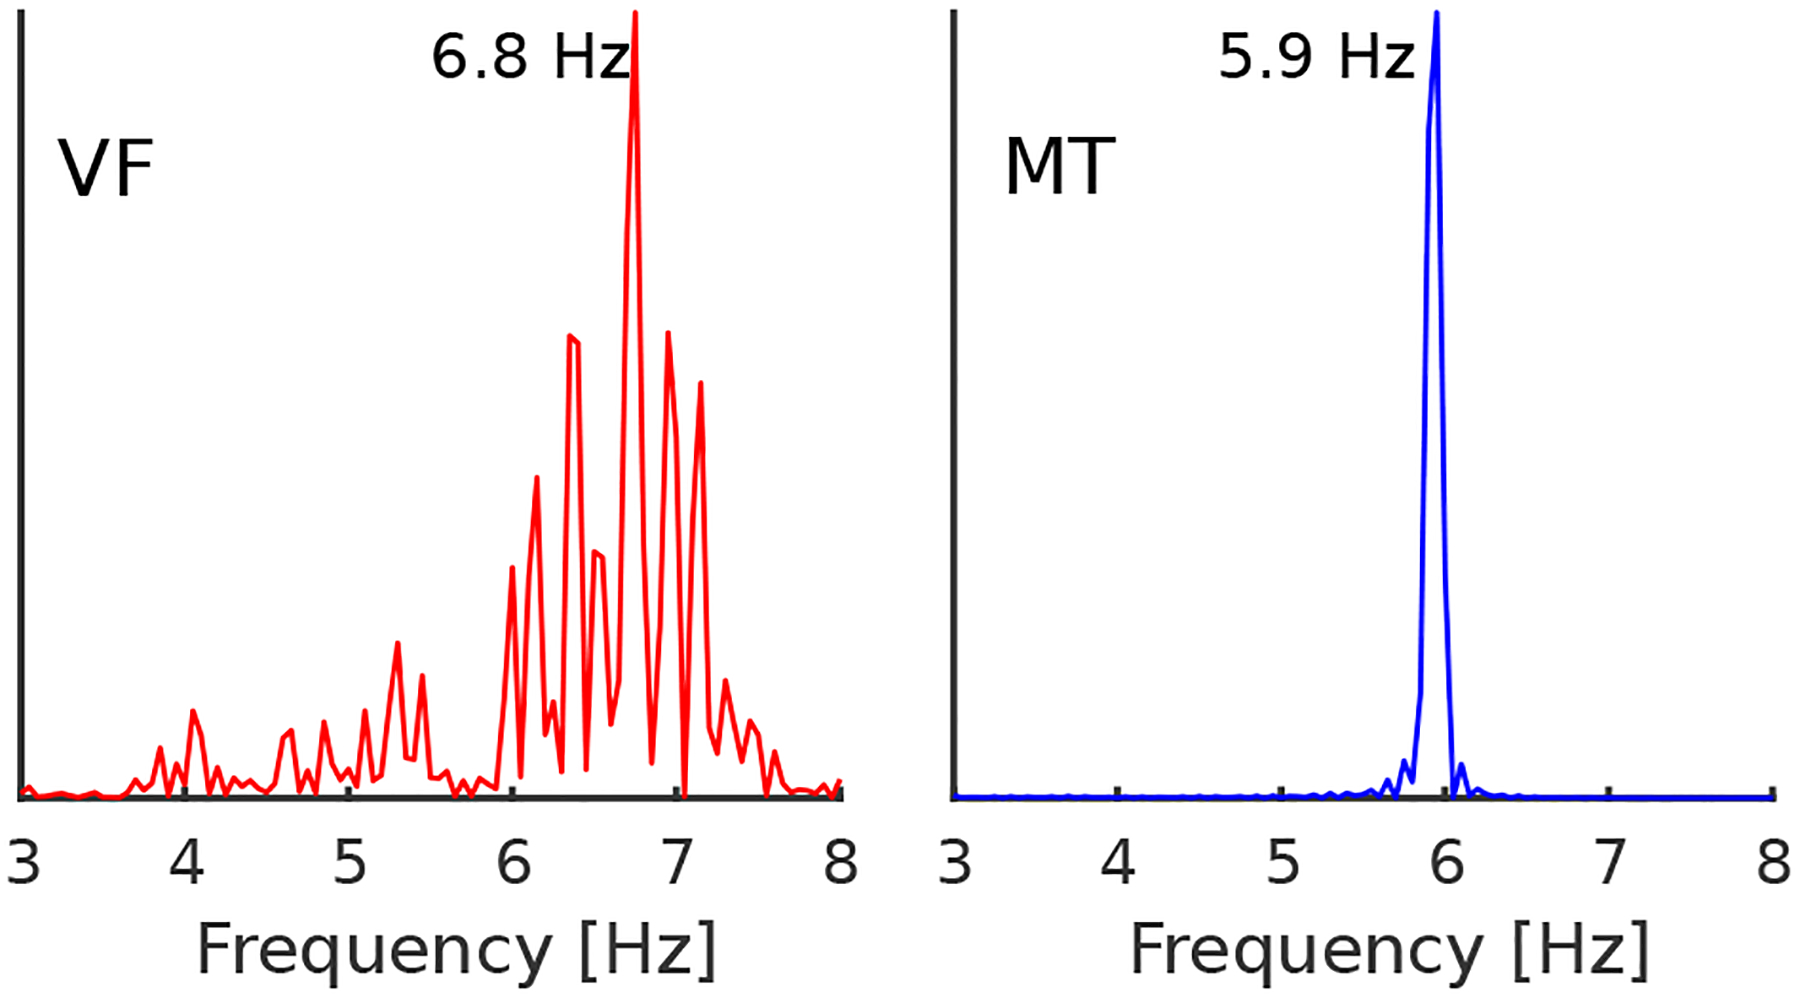
Figure 4.

Frequency spectra of the optical AP signal. During VF, the frequency spectrum has a broad peak around the dominant frequency of 6.8 Hz which indicates complex VF driven with the multiple spiral waves, and dynamically induced heterogeneities during tissue repolarization and depolarization. Upon successful resynchronization, a sharp peak indicates the presence of organized ventricular activity externally driven with the feedback controller.
