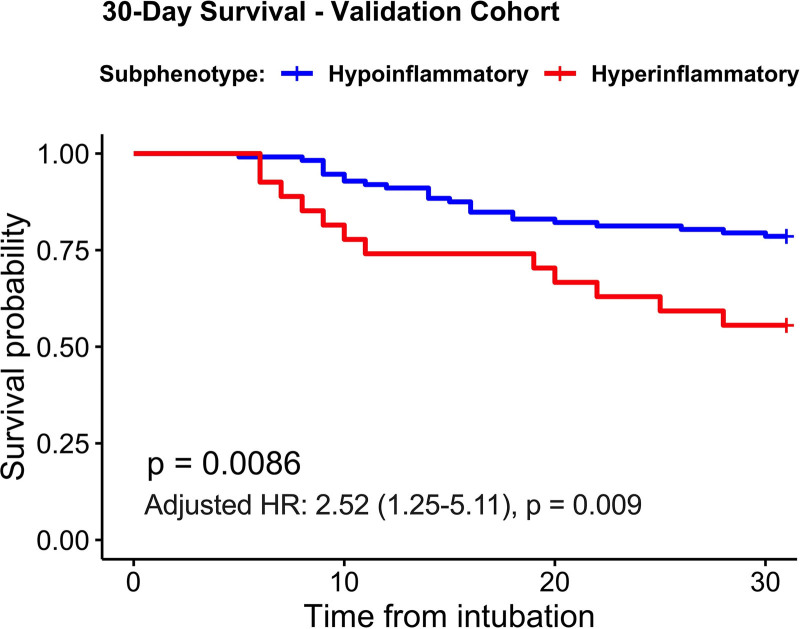
Figure 5.
Hyperinflammatory patients in the validation cohort had worse 30-d survival compared with hypoinflammatory patients. Kaplan-Meier curves for 30-d survival for each subphenotype, as derived by the four-variable parsimonious model. p values for differences between subphenotypes were obtained with a log-rank test. Adjusted hazard ratios (HRs) with 95% CIs are displayed for the effects of the hyperinflammatory subphenotype, as derived from a multivariate Cox proportional hazards model adjusted for age and clinical category of acute respiratory failure (coronavirus disease 2019 [COVID-19] acute respiratory distress syndrome [n = 40], COVID-19 pneumonia not intubated [n = 40], and non-COVID acute respiratory failure [n = 59]).

