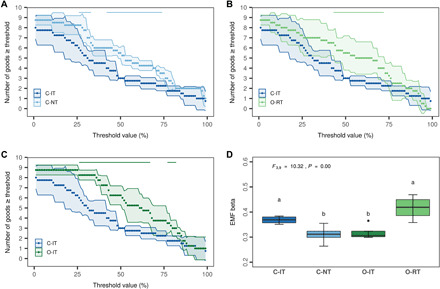
Fig. 5. Diversity measures for agroecosystem good delivery.

(A to C) Effect of cropping systems on the number of goods performed above a threshold [mean (points) ± 95% confidence intervals (shades), n = 4; horizontal lines indicate sections of significant differences to C-IT]. The continuous thresholds (%) are applied on the scaled good values (0 to 1). (D) Beta-multifunctionality, calculated as the average dissimilarities of goods supply between cropping systems. The higher the value, the more specialized is good delivery (few goods at higher level). F value (df1, numerator degrees of freedom; df2, denominator degrees of freedom) for the corresponding linear mixed model is displayed for the boxplot, and different letters indicate significant differences between the four cropping systems [pairwise comparison with estimated marginal means (emmeans package), n = 4]. Boxplot displays the median (horizontal line), the 25th and 75th percentiles (colored box), the minimum and maximum (whiskers), and outliers (points).
