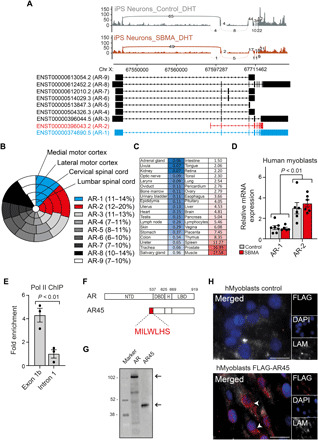
Fig. 1. Gene expression profiling of the AR-2 isoform.

(A) Sashimi plot depicting alternative isoforms for the AR gene generated from RNA-seq data in iPS-derived motor neurons from unaffected (control) and SBMA individuals. The number in the line represents the reads crossing a particular splice junction (curved lines). A scheme showing AR-1 (blue), AR-2 (red), and the other annotated AR isoforms is shown below. (B) Nested pie chart shows the proportion of mRNA AR isoforms levels from postmortem human tissues expressed as log-normalized counts. Percentage range for each isoform is in the parenthesis. (C) Heatmap indicating relative AR-2 transcript levels in human tissues normalized to GAPDH. (D) Relative mRNA expression levels normalized to GAPDH of AR-2 compared to AR-1 in human myoblasts from SBMA and unaffected subjects. (E) Chromatin immunoprecipitation (ChIP) from AR45-transfected MCF7 cells using anti–Pol II antibody shows increased occupancy on exon 1b of AR gene compared to a downstream sequence. (F) AR and AR45 protein domain conservation is shown. H, Hinge domain. Amino acid numbers refer to full-length (FL) human AR. Sequence of AR45 NTD is shown in the magnification. (G) Immunoblotting using an anti–C-terminal AR antibody of human embryonic kidney (HEK) 293 whole cell lysates where AR or AR45 was overexpressed. Size corresponding to the two isoforms (arrows) is expressed in kilodalton and displayed next to the protein marker. (H) Immunofluorescence micrographs of DHT-treated unmodified (control) or expressing endogenous FLAG-tagged AR45 (FLAG-AR45) human myoblasts. Cells were stained with anti-FLAG antibody (red), anti-laminin antibody (LAM; white), and 4′,6-diamidino-2-phenylindole (DAPI) (blue). Arrowheads indicate the AR45 signal. Scale bars, 20 μm. Data in (D) and (E) are means ± SEM. Each dot represents one replicate.
