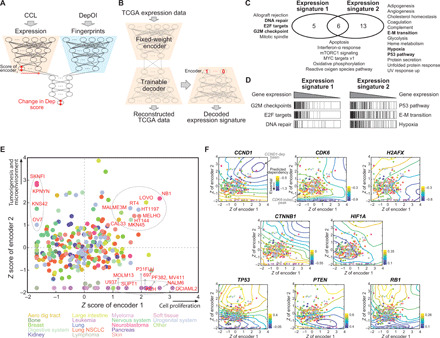
Fig. 3. Characterization of gene dependencies using Exp-DeepDEP.

(A) Architecture of Exp-DeepDEP and its usage in characterizing gene dependencies. We examined encoded expression nodes for the relevance of gene dependencies. (B) Networks for decoding the encoded expression nodes. We retrained a decoder network to reverse the encoder of Exp-DeepDEP [as shown in (A)] using TCGA samples. A vector with 1 at the node of interest and 0 otherwise was fed into the decoder to reconstruct a decoded gene expression signature. (C) GSEA analyses of expression signatures decoded from two encoder nodes. Hallmark gene sets with significant positive enrichments (FDR, <0.001) in each expression signature are listed. E-M transition, epithelial-mesenchymal transition. UV, ultraviolet. (D) Enrichment plots of selected gene sets [bold in (C)]. (E) CCLs by z-transformed scores of the two encoder nodes. Samples with high scores specifically in one node (≥1 in one node but minimum in the other) or both nodes (≥1 in both nodes) are denoted by dashed circles. (F) Essentiality maps of selected genes. An essentiality map was generated using contours of the dependency scores generated by intervening the two encoders for each gene dependency. Dark blue (or yellow) indicates an area where knocking out a gene has strong (weak) inhibitory effects. Dots (CCLs) and axes are identical to (E).
